This Is Bad
I have eight of my favorite people at my place for the new year, twenty-two more on the way, two game consoles hooked into digital projectors, a bathtub with beer on ice, great weather, but I can’t get my mind out of the classroom.
The Preoccupation
Among the ages I teach, math has changed very little in the last quarter century and certainly at nowhere near the pace of technology or (more importantly) my kids’ creativity.
So for the last year I’ve been building a course from scratch, connecting a lot of loose, fun material, grafting it on the back of your standard Algebra 1 curriculum, infusing the whole thing with visuals from start to finish, and then personalizing it, setting expectations such that, by the end of the course, every student will have the same skill set but entirely different work portfolios depending on personality and preference.
Furthermore, the course lives in the intersection of English and Math. It depends as much on articulate self-reflection as it does on mathematical computation.
My White Whale
I haven’t met another math teacher as consumed by information design as I am, as convinced that it can invigorate a subject that most students find irrelevant, and maybe that’s because I’m the crazy one here, playing a lanky Captain Ahab to a white mathematical whale.
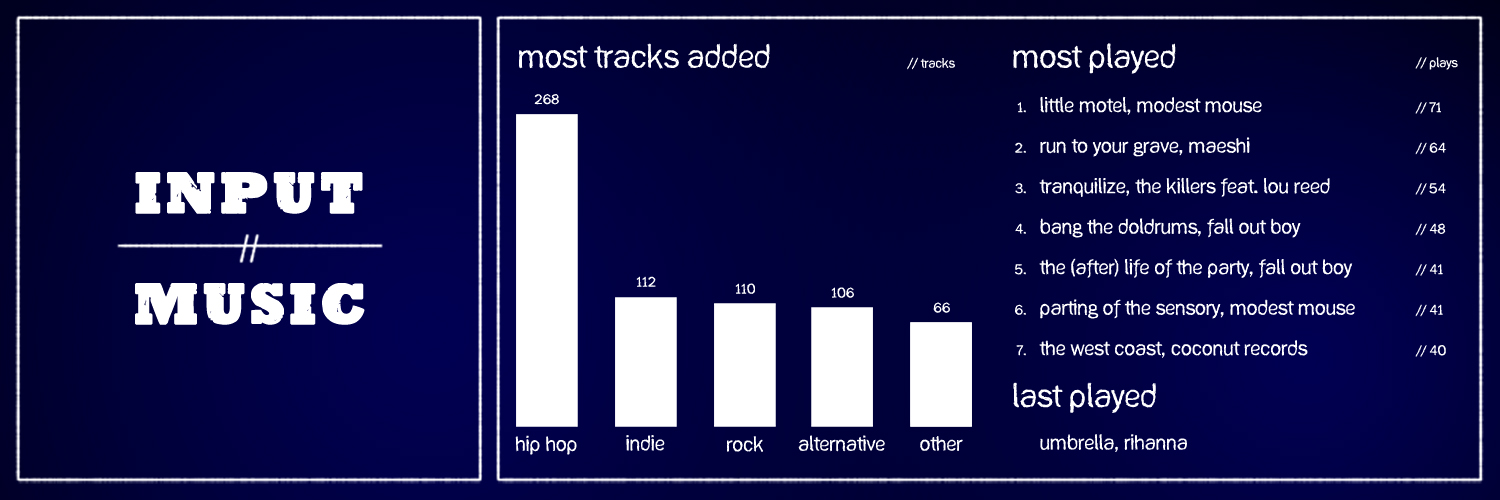
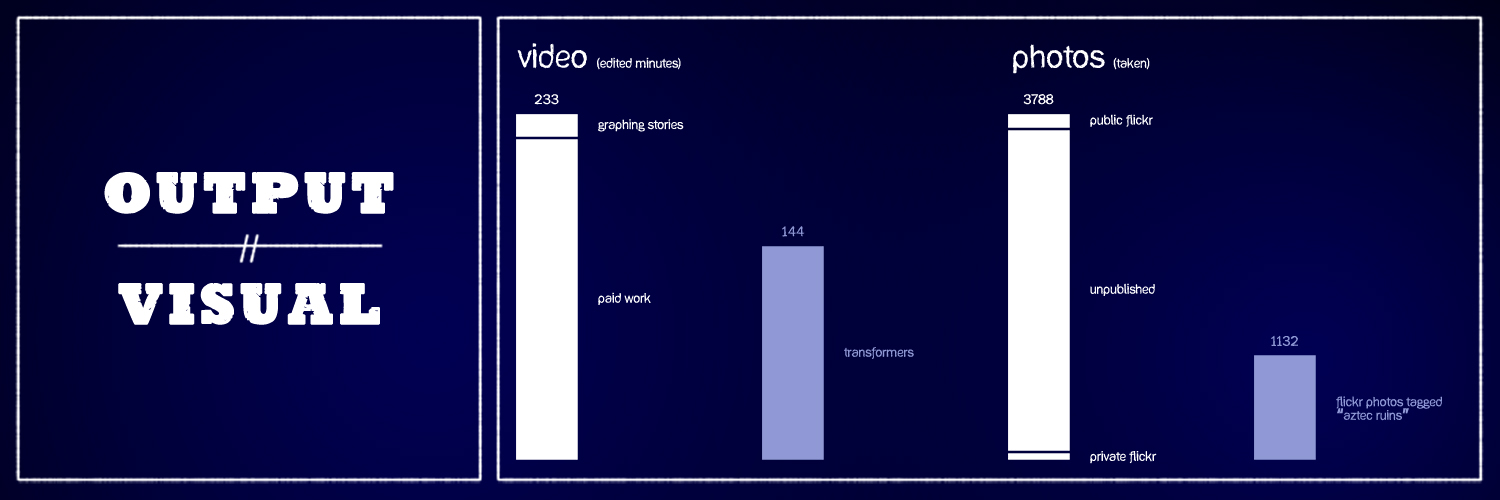
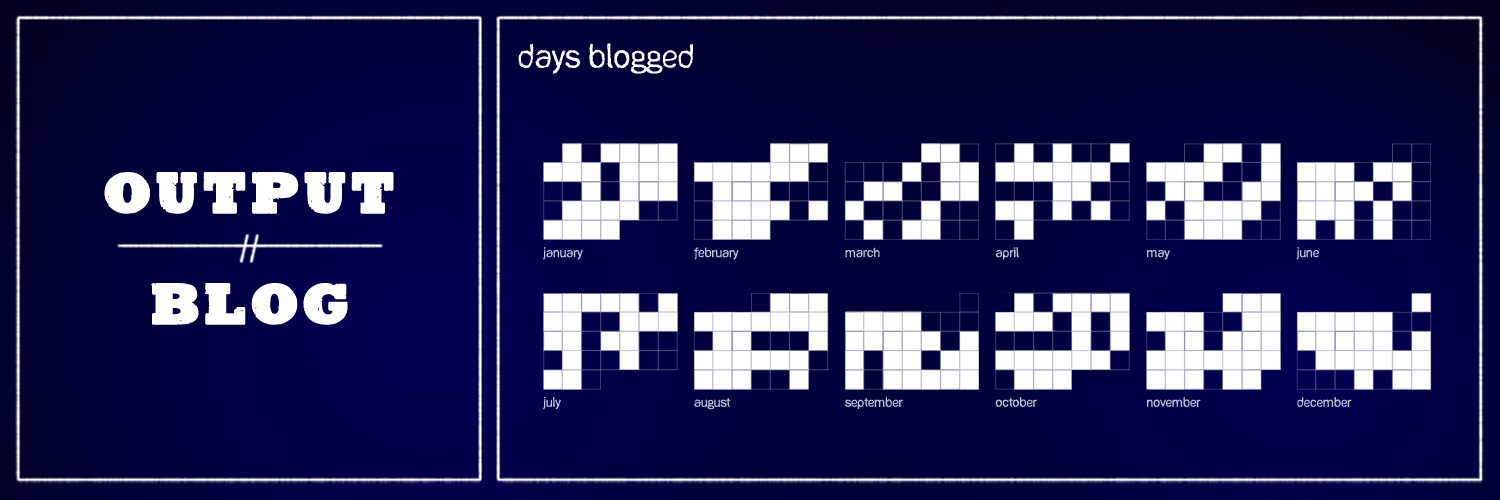
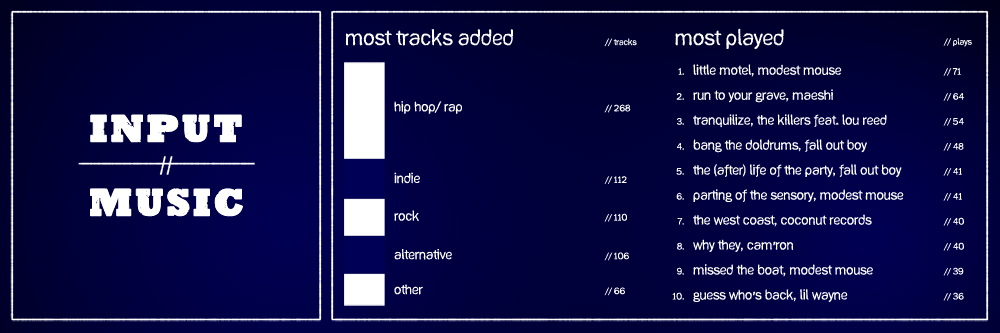
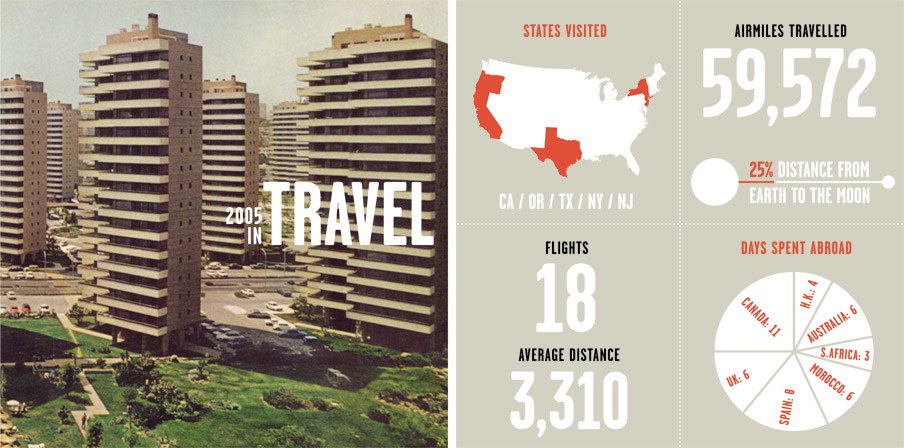
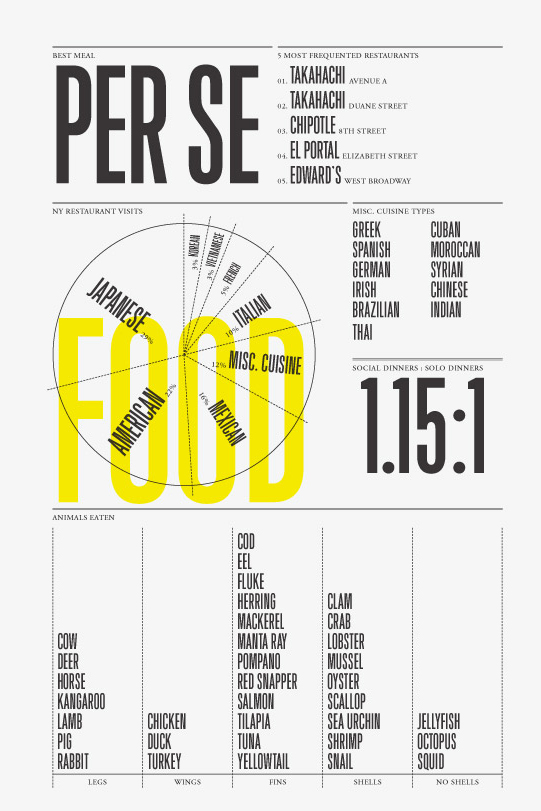
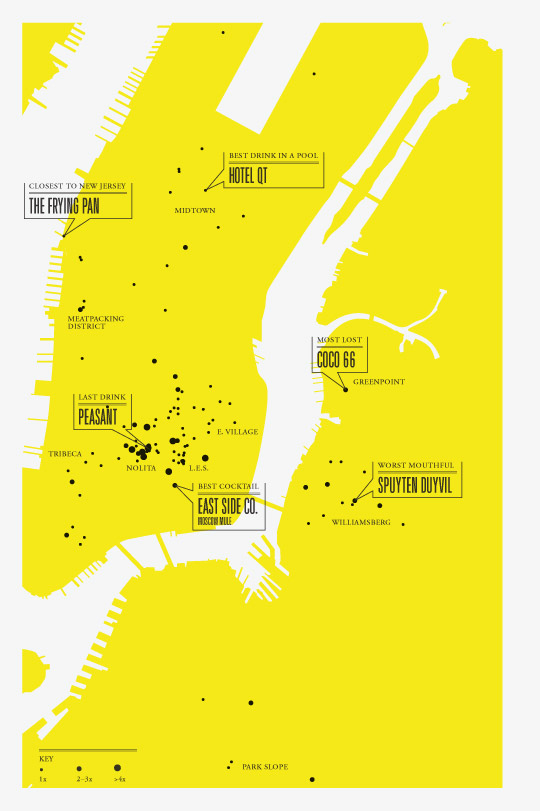
Who Is Nicholas Felton?
But I don’t think so and here, at the year’s end, a guy named Nicholas Felton has offered me the single piece of tape which fastens together hundreds of techniques and web links and my mind won’t. shut. down.
So it’s about to get Very Busy around here. I’ll soon post a loose-limbed course syllabus which will precede an explanation of Nicholas Felton’s enormous (and most likely oblivious) contribution to math education which will precede our winter design contest, which will be at least as fun as the last one and certainly more challenging.
In all of these, your participation is requested.