Category: algebra

Total 36 Posts

How Old Is Tiger Woods?

If you asked me to name something that’d trigger a teenager’s passion, I wouldn’t leap at “Correctly Guessing a Has-Been Celebrity’s Age” straight away. But there they were, hollering, competing, and rallying over near misses like frat boys over fantasy football.

  • You have your students make three columns: Name, Guess, and Actual.
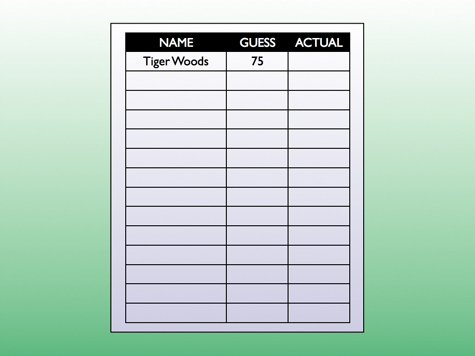
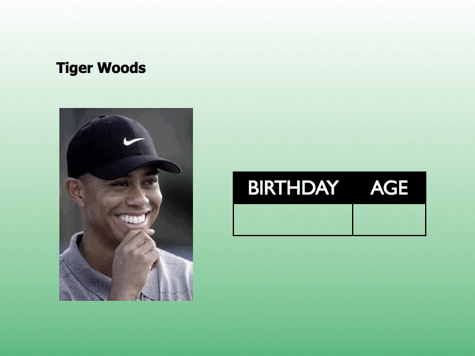
  • You project twenty-or-so celebrities (a broad range of ages) onto the wall. You have ’em guess the age out loud.
  • As they toss out guesses you say, “It’s probably a bad idea to toss out your guess. We’re all competing for the title of Best Age Guesser. Keep ’em close.”
  • You keep projecting, they keep guessing. Maybe you ask ’em, “twenties or thirties or forties?” to keep ’em participating together.
  • Then you go back through and give the ages. They write those under the “Actual” column. Watch ’em get crazy here, freaking out ’cause they were only three years off Natalie Portman’s age. Watch some of ’em blow Nelson Mandela by decades.

Enter the mathematics here:

  • You ask, “how do we decide who guessed the best?” Expect intial suggestions like, “Whoever guessed the most right.” and “Whoever got closest to each age.”
  • Take care of that first suggestion by asking who got the most right (Vicki, let’s say) and then ask the class, “Can we stop searching for the best guesser now? Is Vicki guaranteed? Why not?”
  • Ask for clarification on the second suggestion. Get to a place where they’re subtracting the actual answer from the guess, getting negative numbers for underguesses and positive number for overguesses.

Make the math as hard or as easy as you want here.

Algebra and Below:

  • Someone will suggest you add the new column of numbers up. You ask, “What number do we want there?”
  • Someone’ll suggest “Zero.” You talk about the girl who overguesses Tiger Woods by 30 years and underguesses Oprah by 30 years.

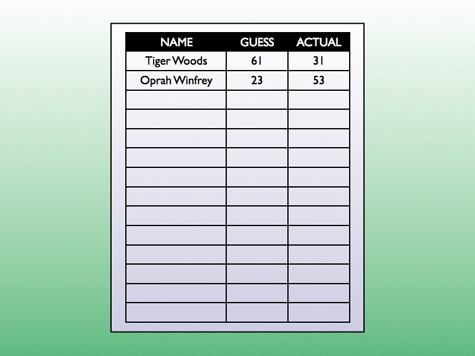
    Girl has a zero but couldn’t guess your age if you handed her your driver’s license.

  • “So what do we do?”
  • Drop the negatives. It doesn’t matter if you guess over or under, only that you’re off.
  • Have them find the mean of their new column, full of positives. What does it mean? (The average number of years they were off per guess.)
  • Ask if it means they guessed over or under on average. (Can’t tell, we dropped the negatives.)
  • Have them find the average including the negatives. (“Who guessed under on average? Who guessed over?”)

Algebra II:

  • Connect this to absolute value.

Calculus:

  • Talk about why the square of the differences is preferable to their absolute values. (x2 is differentiable where absolute value isn’t.)

Give the winner a fun-sized candy bar. Let her select a celebrity for inclusion in next year’s lineup.

Attachments:

Credit Where It’s Due:

Got this idea from my ed-school mentor several years back. Yo, AB, I still use your stuff, man.

[Update: Matt has some pretty priceless extensions to this lab.]

How does the Mean and Median of all student guess do in this competition?

Creating a histogram of the guesses.

Looking at the standard deviation of the student guess. Do standard deviations vary with the age of the person.

And I reply:

Oh yeah, thatโ€™s great. Itโ€™s so clear now. I need to feature as many or more celebrities as there are students in the class. After the main event then I assign a celebrity to each student, they collect the guesses from around the class and perform a statistical analysis. Maybe I have Keynote slides set up so they punch in their data and present it real quick.

For Your Consideration:

Peace and prosperity. Vote dy/dan best new edublog and best individual edublog.

ID115: Pie Charts – Movie Posters

Similar to ID111 but with movie posters. Somewhere in between these two we practiced measuring and drawing angles.

I stressed that I wanted their reaction to the poster itself and not to the movie, which some students doubtlessly hadn’t seen.

I included two of my favorite one sheets. Reactions came back mixed and I lamented silently how NCLB has looted artistic appreciation in our nation’s public school for corporate fun and profit.

Fun questions to ask (again):

  1. Who loved the most one sheets?
  2. Who hated the most one sheets?
  3. Whose one sheet was the most hated?
  4. Whose one sheet was the most liked?

One Sheet Analysis Template (student carries this from desk to desk)
Personal Pie Graph Template (student makes her personal pie graph on this)
One Sheet Analysis Template II (this stays with each one sheet for students to mark)
One Sheet Class Analysis Template (this follows the one sheet from class to class)
The One Sheets We Used (formatting is left as an exercise for the reader)
Student Protractors (print ’em out on overhead transparency)

ID111: Stacked Bars – Album Covers

I downloaded thirty-or-so old school album covers (like, old school), enough for each member of them class, printed them all out on matte photo paper for $4.50 at a photo boothBumped into some trouble with one printer who cited copyright restrictions. ¶ I tried as pleasantly as I could to explain that what she didn’t know about Fair Use could fill up the Grand Canyon and spill over the sides. Dialogue kinda spiraled down from there. Next I knew some rent-a-cop was ushering me outside. ¶ (Well how would you have handled the situation?), and passed one out to each kid along with a tally sheet.

The kid categorized her reaction to her own album cover as one of “Love,” “Like,” “Dislike,” or “Hate.”Hence, old school album covers. I wanted them to react to the design, which everyone could respond to, whereas if they had heard the album, an unbiased, informed opinion would be a tough to ask of every student. The student then wandered from desk to desk, making two marks per album cover. One on her own sheet, which she carried with her, and one on the tally sheet, which stayed at a desk.

Then she got back to her desk and made two stacked bar charts. One for her own design tastes. And one for how well the class regarded her album cover.

I used the same album cover for each of my three algebra periods and had them use the same color legend so the result was a kind-of-slick representation of how the classes differed. (For instance, third period had some extreme reactions to the Devo cover below while the other two periods were more tempered in their enthusiasm.)

Fun questions to ask:

  1. Who loved the most covers?
  2. Who hated the most covers?
  3. Whose cover was the most hated?
  4. Whose cover was the most liked?

Stacked Bar Template I
Album Covers We (Dis)like Handout
The Album Covers We Used (ready for 4×6 printing)

ID107: Stacked Bars – Music Genres

Homework the previous night was to record the genre of the next 25 songs they listened to. I showed ’em how to sort their songs by “Last Played” in iTunes.

They came back the next day and I had them tally up their genres, again, building stacked bars of their music preferences. Everyone used the same color/genre legends and we posted a long strip of music preferences on the back wall.

For reasons I can’t quite recall, I had them come up to my laptop at the front and punch their preferences into a GoogleDocs spreadsheet also. Makes me sound like some School 2.0 badass but I didn’t do anything with it that I can remember.

I did beat it into them over and over again how cool it was we could draw conclusions about our class’ preferences at a quick glance.

Music Analysis Homework
“Music We Like” Wall Poster