[following up from here]
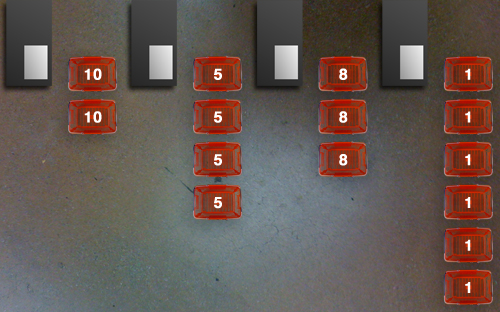
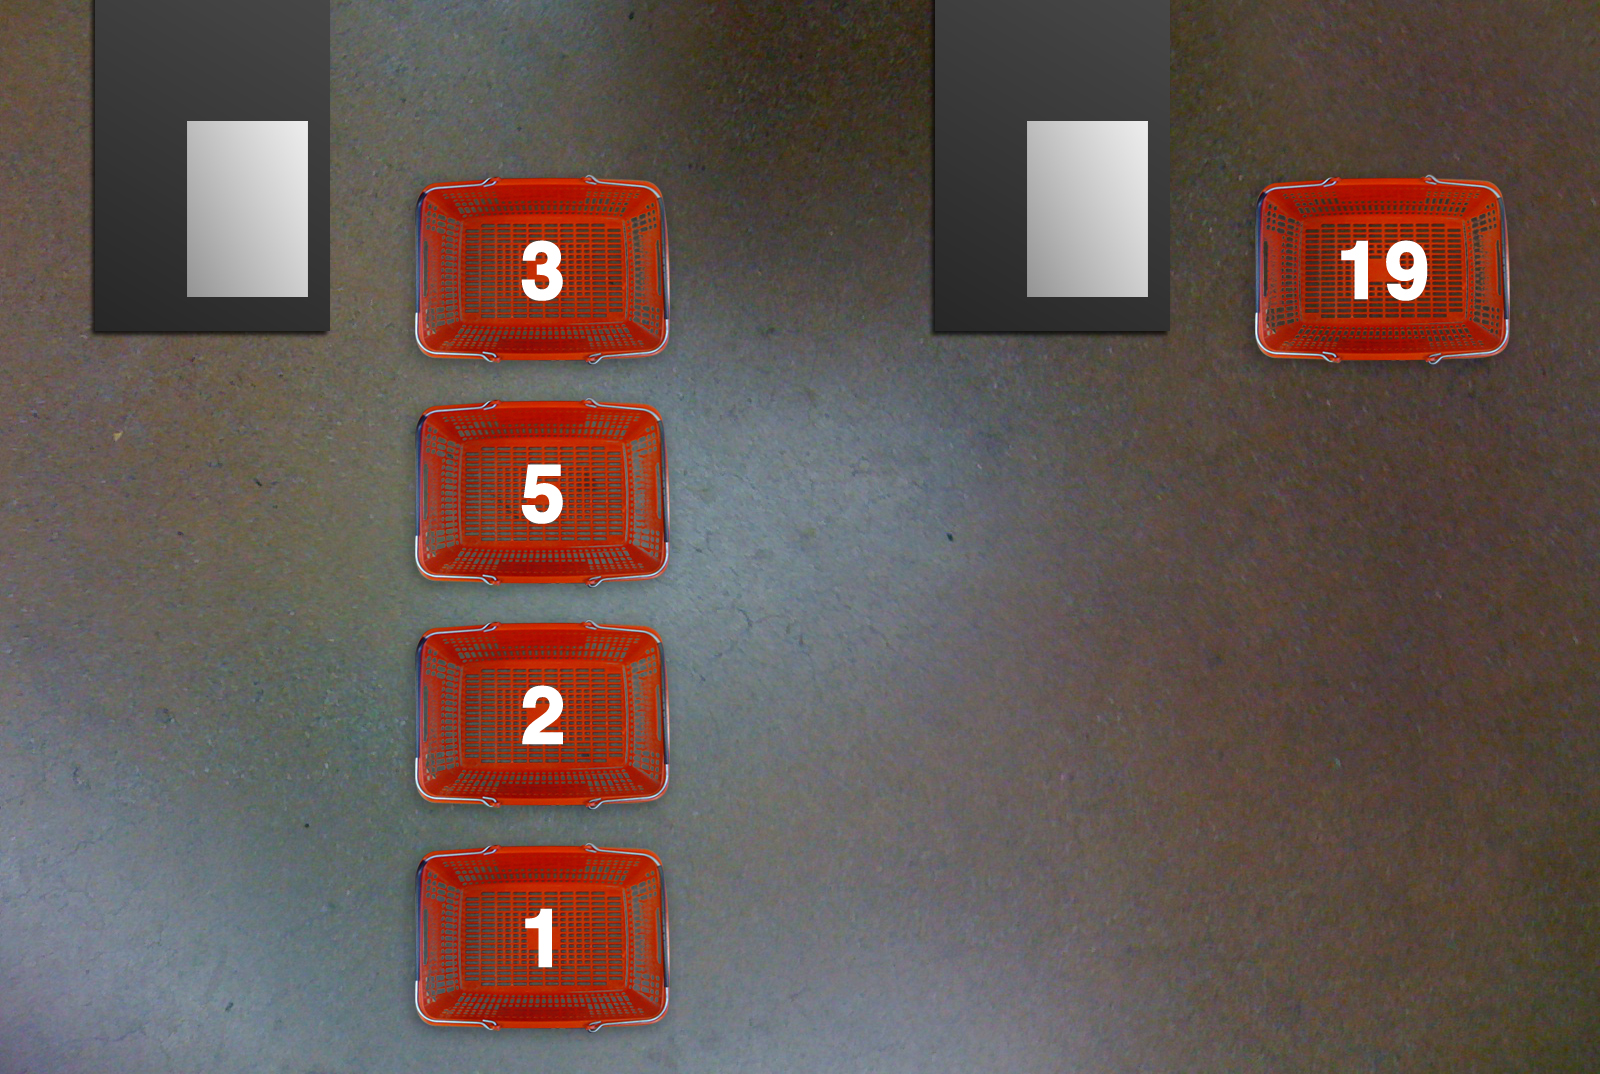
All other things being equal, which lane is the fastest?
This problem has obsessed me for years. It’s my DaVinci code. It’s my love for math, for mathematical reasoning, for the relentless deconstruction of something that seems simply intuitive into data, models, and computation.
This is also my love for WCYDWT media.
Perfunctory Pitch For WCYDWT Math Instruction
You have here a simple question that anyone can access. Doesn’t matter that you’ve never run a linear regression in your life. If you’ve ever shopped for groceries, if you’ve ever stood in line with a candy bar, a soda bottle, and a matinee starting across town in ten minutes, you have an opinion here. And I can use that.
The question is simple and so is the answer but the justification is extremely complicated, which is exactly how I’d like to balance the learning experience. We will argue. There are easily a dozen variables affecting the line speed that have nothing to do with the number of customers in each line or the number of items in their baskets. You could assign some field research here. I spent ninety minutes last week just watching, counting, and timing groceries as they slid across a scanner.
The question is also scalable. We can remix this single image into endlessly difficult scenarios (or easier scenarios) that will push a student’s hypothesis to the crumbling point and back again.
A (Broad) Lesson Plan
Gather the data. Or supply the data. Graph the data. Develop a model. Test the model. Talk about the effect of outliers. Assign weight to outlying variables.
I threw some questions on a worksheet five years ago, fairly predictable stuff like “what does it mean when a point is above the line of best fit?” At this point, though, I’m hesitant to constrain the activity even that lightly. I’d almost rather pick a fight with a student who finished early and let the rising pitch of that conversation fold in a few more learners.
Other Remarks
-
Check is slower than credit which is slower than cash. Students are sometimes surprised that cash is faster than credit. From my observations, the fastest cash transaction will outpace the fastest credit transaction by a wide margin but there is also huge variance in credit transactions. I mean, some people have absolutely no idea what they are doing with that thing. The same can’t really be said of cash.
-
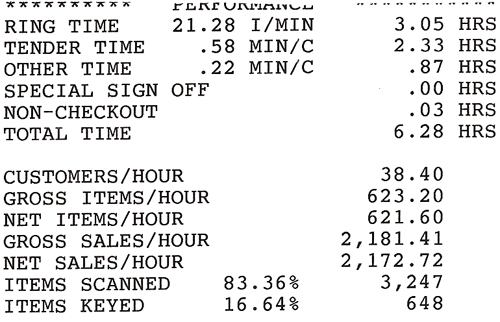
The store manager hooked up some checkout data, which was awesome. At first, he declined my request for numbers while agreeing to let me float around the store. Then he brought back the mother lode: checkout scanner data from a single six-hour shift. The data was aggregated in a few unhelpful ways but no way do I mind this particular excerpt, which gives away the store:
-
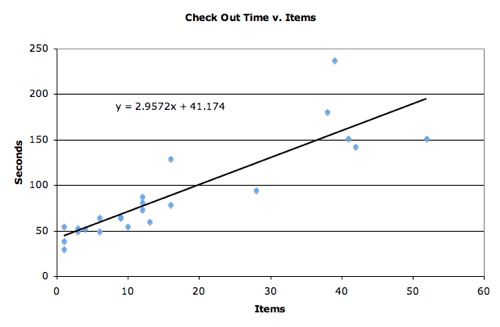
The y-intercept is non-zero! This never fails to trip my fuses. It should take you zero seconds to purchase zero items but you can’t ignore the fixed time cost of the pleasantries (“Hi. How are you doing? Do you need any help out?”) and the transaction itself.
-
The express lane isn’t faster. The manager backed me up on this one. You attract more people holding fewer total items, but as the data shows above, when you add one person to the line, you’re adding 48 extra seconds to the line length (that’s “tender time” added to “other time”) without even considering the items in her cart. Meanwhile, an extra item only costs you an extra 2.8 seconds. Therefore, you’d rather add 17 more items to the line than one extra person! I can’t believe I’m dropping exclamation points in an essay on grocery shopping but that’s how this stuff makes me feel.
Here’s the Photoshop template, which you’re welcome to remix with new numbers or, even better, revamp into something altogether less offensive to the eye.
[BTW: check out this fun snap from Dan Callahan of the Whole Foods staff bulletin board.

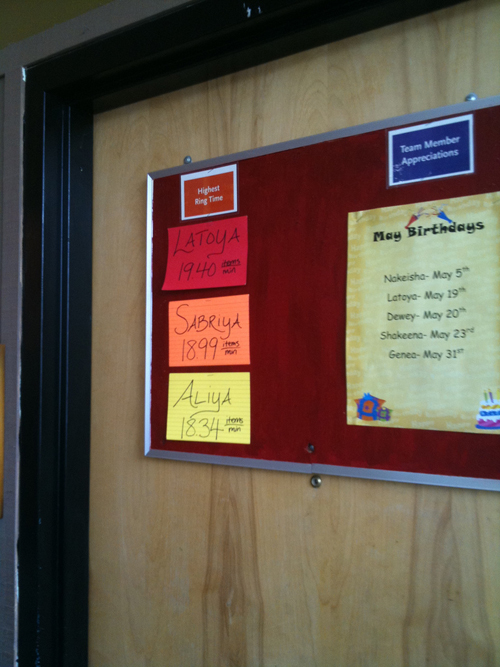