Brett Gilland coined the term “mathematical zombies” in a comment on this blog:
Students who can reproduce all the steps of a problem while failing to evidence any understanding of why or how their procedures work.
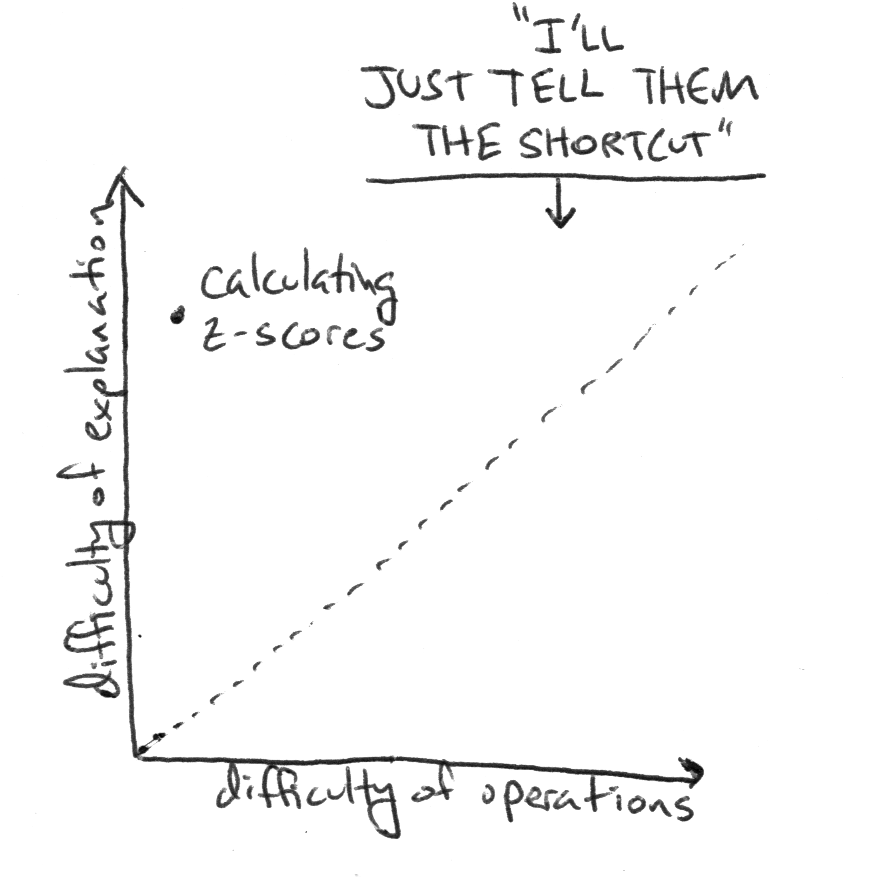
When I think about mathematical zombies, I think about z-scores — how easy it is to calculate them relative to how difficult it is to explain those calculations.
Check it out. Here is the formula for a z-score:
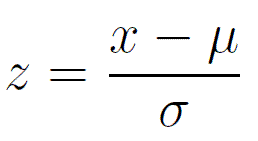
In words:
1. You subtract the mean from your sample.
2. You divide that by the standard deviation.
Subtraction and division. Operations simple enough for a elementary schooler. But the explanation of those operations —Â why they result in a z-score, what a z-score is, and when you should use a z-score — is so challenging it eludes many graduates of high school statistics. Think about how easily you could solve these exercises without knowing what you’re doing.
That difference brings this chart to mind and helps me understand all of the times I’m tempted to just tell students, here’s how you do it already so now just do it. That’s where the operational shortcuts are most tempting.
All of this is preface to a lesson plan on hypothesis testing by Jeremy Strayer and Amber Matuszewski, which is one of the best I’ve read all year.
Hypothesis testing is, again, one of those skills that’s far easier to do than to understand. As you read the lesson plan, please keep in mind that difference. Also notice how capably the teachers develop the question, disclosing the mathematics progressively, and resisting the temptation to shortcut their way to operational fluency.
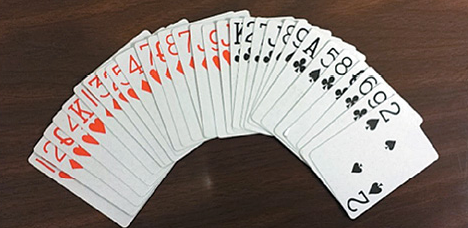
It’s spectacular. I’m struck every time by a moment where Strayer and Matuszewski ask students to model an experiment with playing cards, only to model the exact same experiment with a computer later. They didn’t just jump straight to the computer simulation!
Here is a video of an airline pilot landing an Airbus A380 in a crosswind. This is that for teachers.
Featured Comment
Amy:
I always think of z-scores as a set of transformations from one plain-vanilla normal curve to the hot-fudge-sundae Standard Normal curve. Maybe once you see it this way, you can’t unsee it. To me, that helps make sense of the “why” you would bother standardizing and the “how” it’s done.
I’m not sure I agree that z-score is so conceptually difficult as to be worth the shortcut. Though I suppose it requires understanding of standard deviation, which is kind of hard. But if you think of standard deviation as “typical weirdness distance” then z-score as the idea of “how many times the typical weirdness is this point” becomes pretty straightforward. A z-score magnitude of 1 becomes average weirdness, less than 1 becomes less weird than average, etc. The bigger the magnitude of the z-score, the weirder the point.
In introductory stats courses, much of what we do simply comes down to separating “Is it possible?” from “Is it plausible?”. We have seen a wonderful growth in the number of free, online applets which allow teachers and students to perform simulations designed to assess these subtly different questions.


