Year: 2009

Total 161 Posts

My Annual Report Contest II, Second Place: Frieder Knauss

[link to his report]

An appreciation by Sam Shah:

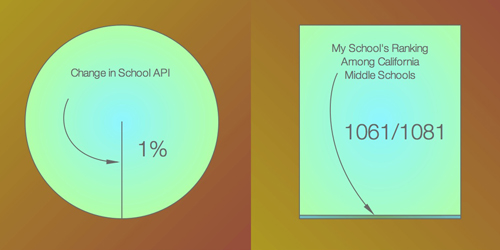
I ranked Mr. K at the absolute top of my list because his slides, simple and minimalist, speak volumes. With just four pieces of data, Mr. K has painted us a picture of a school flailing at the bottom of the rungs. Students are underperforming, the school’s academic perfomance is not improving, and the school is undergoing administrative shifts too. Follow along with me here, for a short minute, because I think there’s something moral about these slides. They aren’t just statistics, but carefully chosen statistics. Mr. K could have written about the number of teachers in his school, or the number of students he teachers, or whatever. Numbers, as a math teacher, abound everywhere. But instead, he gives us this: somewhere underneath these slides is an imperative that things are not okay the way they stand, that things need to change.

Design-wise, Mr. K hit the mark. Using miniscule areas of simple geometric figures highlights, without being obnoxiously in-your-face, where his school and his students lie relative to other schools in California. The fact is simply that using this same technique four times over is synergistic — but only because four such simple and powerful statistics exist. Take a moment and look at each slide individually. They each say something about the place Mr. K spends a preponderance of his time. But as I said, together, they speak as one. And loudly.

My Annual Report Contest II, Third Place: Ben Wildeboer

[link to his report]

An appreciation by Simon Job:

In his Annual Report for 2008, Ben Wildeboer presented a lot of information with clarity, showing a keen eye for design. Each slide presents more than one set of data, yet this is achieved without overcrowding. The Photographs slide, for example, effectively uses bubbles to show not only the location of the photos, but the number at that location. The Running slide was particularly engaging, so much to look at. I really like how the background has been used as part of the data presented.

The Seniority List

Both Joanne Jacobs and Kevin Carey link up Marguerite Roza of the Center on Reinventing Public Education who recommends, in light of forthcoming budget bloodletting, what no one in education has any business recommending: seniority-neutral layoffs.

Seniority”based ”©layoffs ”©exacerbate ”©job ”©loss. ”©For ”©teachers ”©and ”©other ”©K”12 ”©employees, ”©that ”©means ”©more ”©will ”©lose ”©their ”©jobs ”©than ”©if ”©cuts ”©were ”©made ”©on ”©some ”©other ”©basis. ”©It ”©also”© means ”©that ”©schools”© will ”©be ”©left ”©with ”©even ”©fewer ”©employees ”©to ”©do ”©the ”©job. ”©Kids ”©will ”©see”© their”© classes”© get”© even”© bigger, and even more programs will be cut than would be otherwise. ”©And”© lastly, ”©our national unemployment rates will rise even faster than the budget ”©cuts ”©would ”©suggest”©.

“Is that that awful list?” a teacher asked me.

“Yep.” Five legal-size pages in eight-point font hanging to the left of the staff copier.

In a seniority ranking of my district’s 154 certificated employees, I weigh into the bottom 10% at #131. To filter the CRPE report through my perspective, I won’t survive even an 5% cut to our personnel budget (assuming no retirements or transfers) because, under seniority-based layoffs, the district won’t just hack off the bottom 5% of the list (which could decimate an entire department were it sufficiently junior). They’ll distribute that cut over each department in order to preserve a certain degree of balance in the master schedule. And in a seniority ranking of my district’s 10 certificated math teachers, I weigh in at #10.

“Some other basis” is the operative policy black hole in the CRPE report. We don’t have another basis.

“Kitten-Fired Furnace”

Suffice it to say two things:

  1. Laughing hot split-pea soup out your nose is considerably more painful than laughing out the cold, dairy equivalent.
  2. Tom Hoffman calls out the entire edublogosphere in the sort of post that has nudged me incrementally toward a different (or at least more nuanced) definition of “reform” than the one I’ve claimed on this blog for, like, ever. For whatever it’s worth.

My Annual Report Contest II: Final Entries

At this point, we offer each of the following contestants 48 hours (until 16:30 PST 2009 February 5) to send a ranking of their top three picks to dan@mrmeyer.com (excluding their own). A ranking seems almost vulgar in light of all this great introspection and design but these prizes won’t give themselves away, etc.


Sarah Cannon

I like not having the scale shown on these. Full confession, I did not track all of this data, so some of the numbers are guessed. My personal favorite slide is the one with the least fact behind it and my least favorite is the one where I can tell you the numbers exactly. Go figure.


Collette Cassinelli

… this year I used the opportunity to play around with Photoshop – something I never take the time to do.


Simon Job

With Sarah, our first child, born this year — her arrival and impact on our lives defines 2008. These 4 slides show just some of what’s been happening so far.


Fred Knauss

I’m going to side with Don Norman, and say that In a proper design, both are important. Though, if there is some imperfection, I think that having beautifully laid out information that is incomprehensible is worse than an eyesore that tells a good story.


Erick Lee


George Mayo


Alice Mercer

I only had two infographics. Why? I don’t keep a spreadsheet with the minutiae of my life. I know that some consider this useful, or therapeutic. In my family, it usually comes with a three letter acronym diagnosis from the DSM IV. No aspersions on Dan or Mr. Feltron, but I’m not into that.


Alby Reid


Sam Shah

I’m slightly disappointed with this set of slides I made because they don’t tell a story. My slides from last year (2007) told a story – of moving to NYC and changing careers. There was text which explained the stages of my year. This year my slides – hastily done – don’t tell a coherent story.


Claire Thompson Thomas


Ben Wildeboer

Luckily I’m just dorky enough to keep track of a few data sets of interest to me. I was also lucky to have a snow day today- otherwise these would probably not be complete.