When we parted, I described the depressing character of the McGraw-Hill Algebra iBook. Since then, I’ve had a chance to review Pearson’s offering in the same category and, in every way that interests me today, it’s every bit McGraw-Hill’s equal. (In a blind taste test, the only way to tell Pearson from McGraw-Hill is that Pearson includes more embedded multiple-choice quizzes and fewer videos.)
My question, again: what could have been done here? Were the publishers’ ambitions stifled by Apple’s iBook Author tool, which couldn’t accommodate the vast scope of their designs? Or did the publishers lack ambition, and we’re still waiting for a band of enterprising math education bloggers to quit yapping about how awful everything is and release their own curricula with iBooks Author?
Unsatisfyingly, the answer is “a little bit of both.”
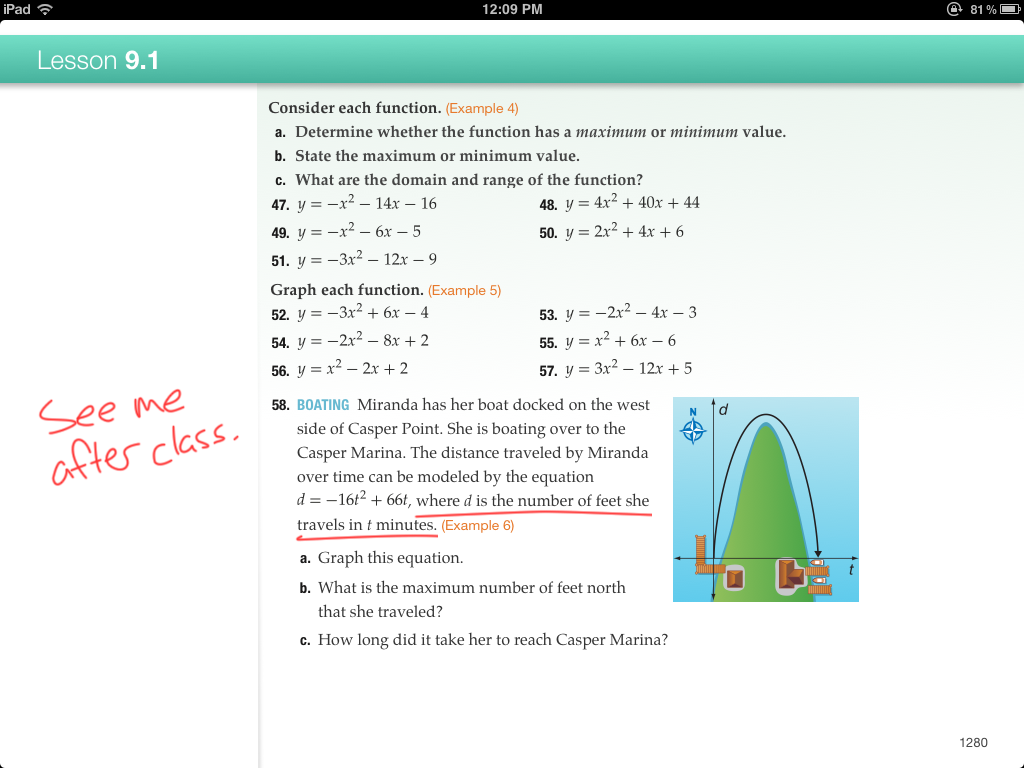
Let’s set aside some of our perennial complaints about math curricula. Yes, they are prone to all kinds of mathematical errors. They pander to kids with snowboarders and breakdancers and whatever else a middle-aged publishing executive thinks kids think are cool. They are written by committees who may never meet, who consequently lack any organizing principles to ensure that the goals of one chapter adhere to those of the next.
We could fix all of those problems in a print product. The problems that are most intriguing to me to me are the ones that are endemic to the print medium. Those are the problems that a digital platform like iBooks Author should help us solve. Here’s a monster:
Textbooks rush to the highest level of abstraction on a context as quickly as possible.
That isn’t a statement about the balance of pure math and applied math in our curricula. Both kinds of problems require abstraction. I’m saying that print products spend very little time letting students decide what features of a pure or applied context are fundamental and which are forgettable. I illustrated this process for applied math last week but the same is true of pure math:
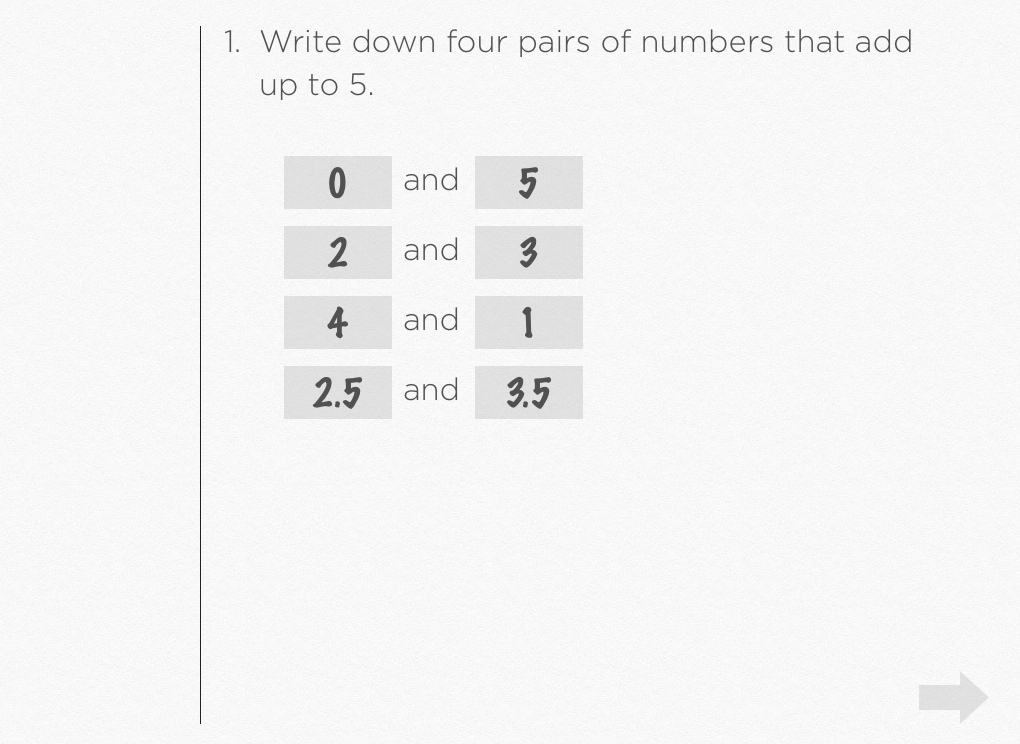
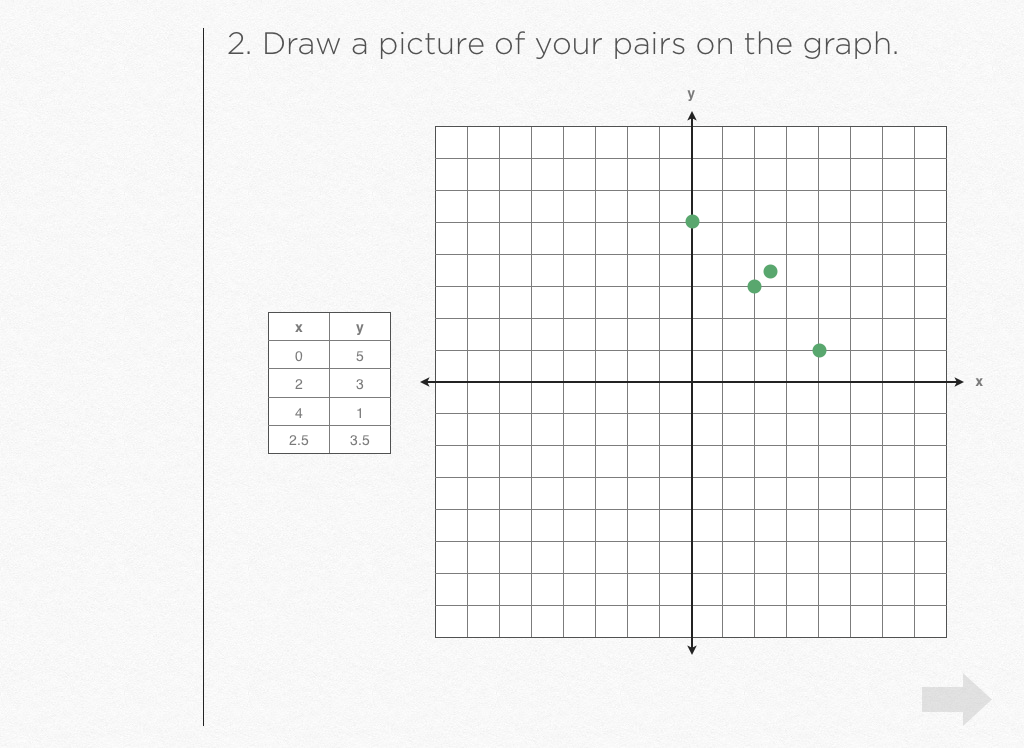
Tell me two numbers that add up to five. Now find me three more pairs of numbers that add up to five. How could we draw a picture of those pairs of numbers? What would that graph look like? Would the points be scattered around randomly? Would there be a pattern?
Print products don’t let our students participate in that abstraction. They just do it. They define x + y = 5 and they describe its graph. They have to, really. The textbook serves a useful purpose as a reference text. At some point, it must define the vertex form of a parabola. It must describe the graphs of equations in standard form. It isn’t enough that the all of those formulas live online in different places. Internal coherence matters.
But textbooks also want to be instructional materials. They want to set up activities and ask questions that help students learn the vertex form of a parabola and learn how to graph equations in standard form.
Those two goals – the goals of a reference text and the goals of instructional materials – cut across each other. On one page you have the textbook asking you interesting questions about shadows and similar triangles. On the opposing page, it fully answers those questions and explains how to apply similar triangles to shadows. It’s like watching a suspenseful movie on one half of the screen while the ending loops over and over again on the other half.
It’s an enormous problem. It makes math too simple for some students by doing important work for them. It makes math too intimidating for others, by introducing math in its most abstract form. That enormous problem results of the limitations of the printed page. Paper is expensive and heavy so you have to make the most of it.
iBooks Author goes some distance to help us fix that problem, to resolve the tension between the textbook as a reference text and the textbook as instructional materials but the publishers either didn’t have the same sense that this was a problem or they sensed the problem and were uninterested in solving it. You can add a new page to your textbook in iBooks Author at the cost of zero dollars. Another page in iBooks Author adds zero pounds to your student’s backpack. The publishers could have afforded to let those problems unfold and breathe, but they didn’t want to or didn’t know how.
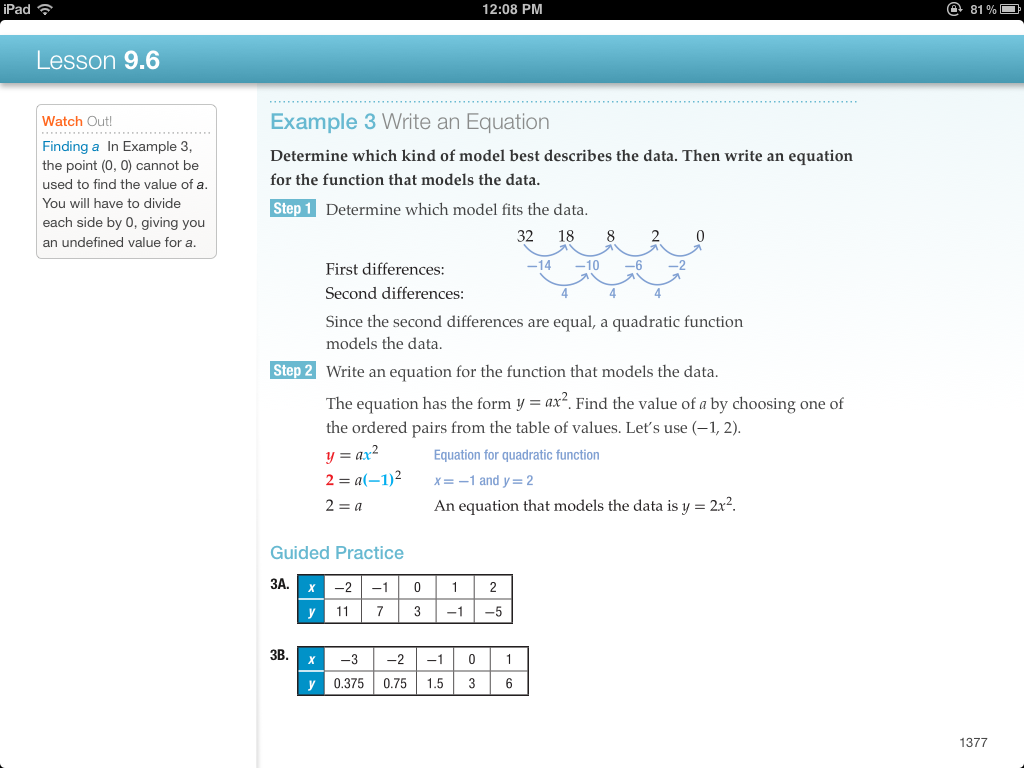
Watch how easy this is. Start with this problem from McGraw-Hill:
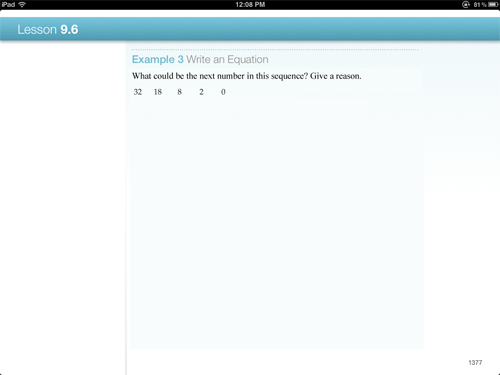
It’s abstracting the problem right in front of students, finding the first and second order differences. Put all of that on the next page. Start this problem with the sequence 32, 18, 8, 2, 0, and ask them:
What could be the next number in this sequence? Give a reason.
Students get the opportunity to look at the numbers and notice that they’re decreasing and then notice that the decreases are decreasing. You have the same high ceiling for exiting this problem. It’s on the next page. But you’ve lowered the barrier to entry for several more students and given everybody the chance to develop some number sense.
And that was pure math. Applied math is even easier:
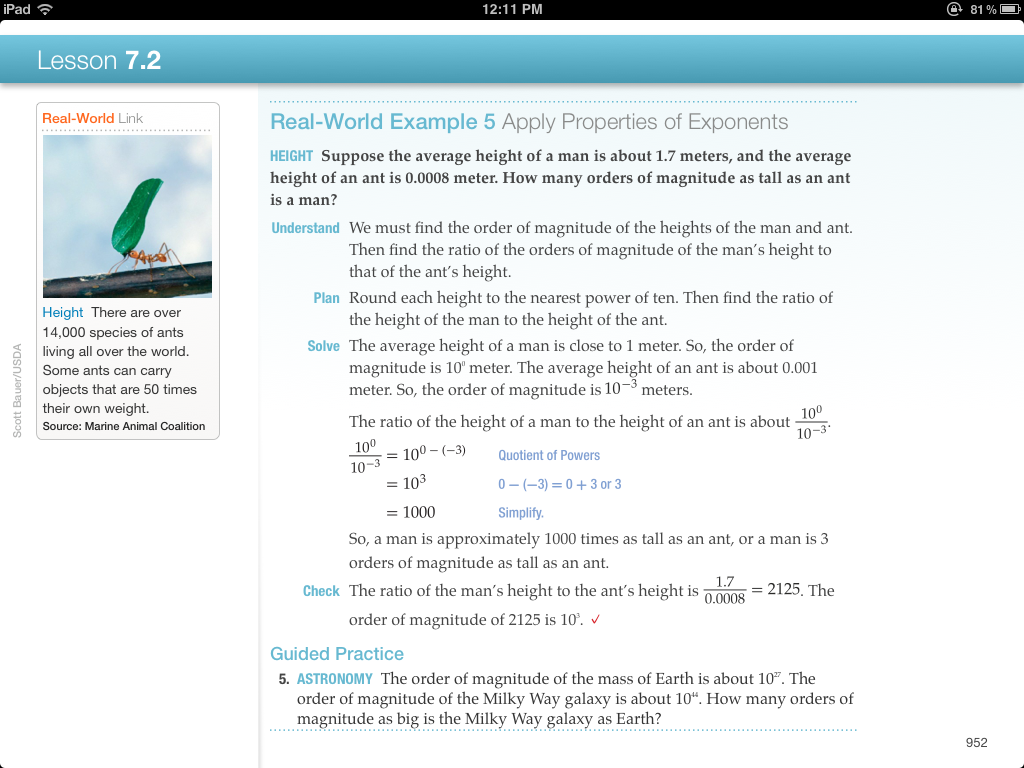
Push all that abstraction onto the next page. Start here:
Suppose the average height of a man is about 1.7 meters, and the average height of an ant is 0.0008 meter. What are different ways we can compare their two heights?
Let me invent a few student solutions:
- The man is a lot taller than the ant.
- The man is 1.6992 meters taller than the ant.
- The man is 2,125 times taller than the ant.
- The man is three orders of magnitudes taller than the ant.
Part of the process of abstraction is to decide what makes some of those responses more useful than others? Students need to see that the first isn’t precise enough; the second doesn’t indicate the relative difference between the man and the ant (ie. the ant could be 10 meters tall, provided the man is 11.6992 meters tall); the third, under some circumstances, is more precise than you need (ie. the relative size of planets); and the fourth, under other circumstances, is just right.
Again, we’ll get to the reference material on the next page. But the only reason for including the reference material on the same page as the instructional material is to accommodate the cost and weight of paper and ink, all of which are totally irrelevant to the production of an iBook.
In that respect, iBooks Author solves a huge problem, but it doesn’t solve it well enough to be worth my while to develop for it. The best textbook I could design with iBooks Author is still one that I’d have to modify heavily for use in the classroom.
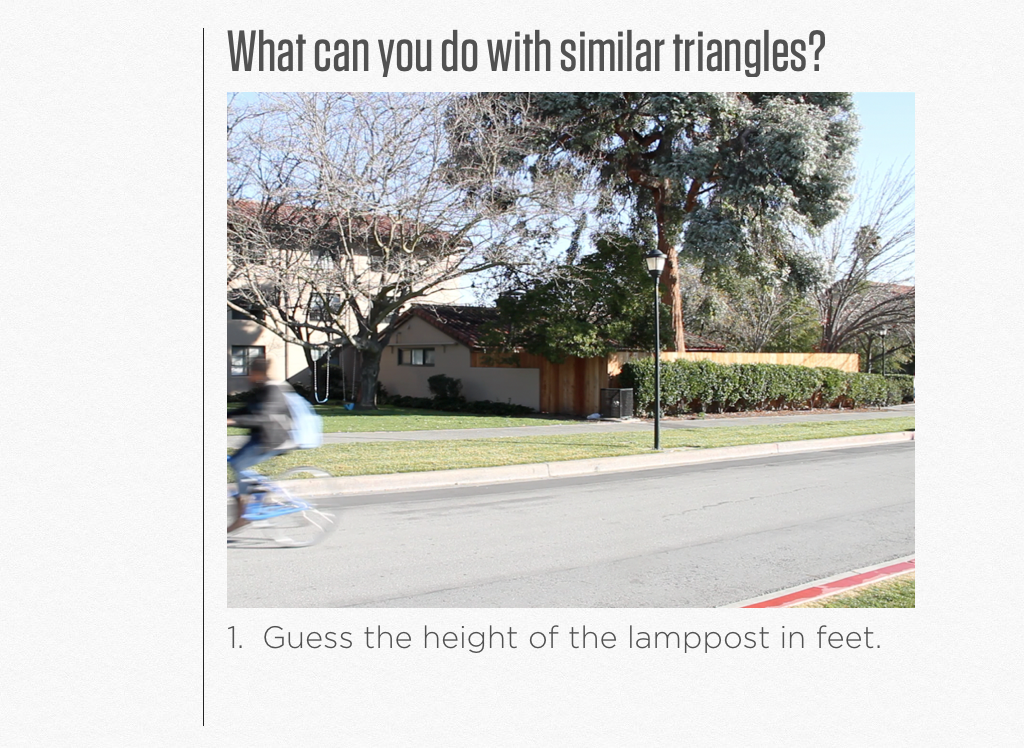
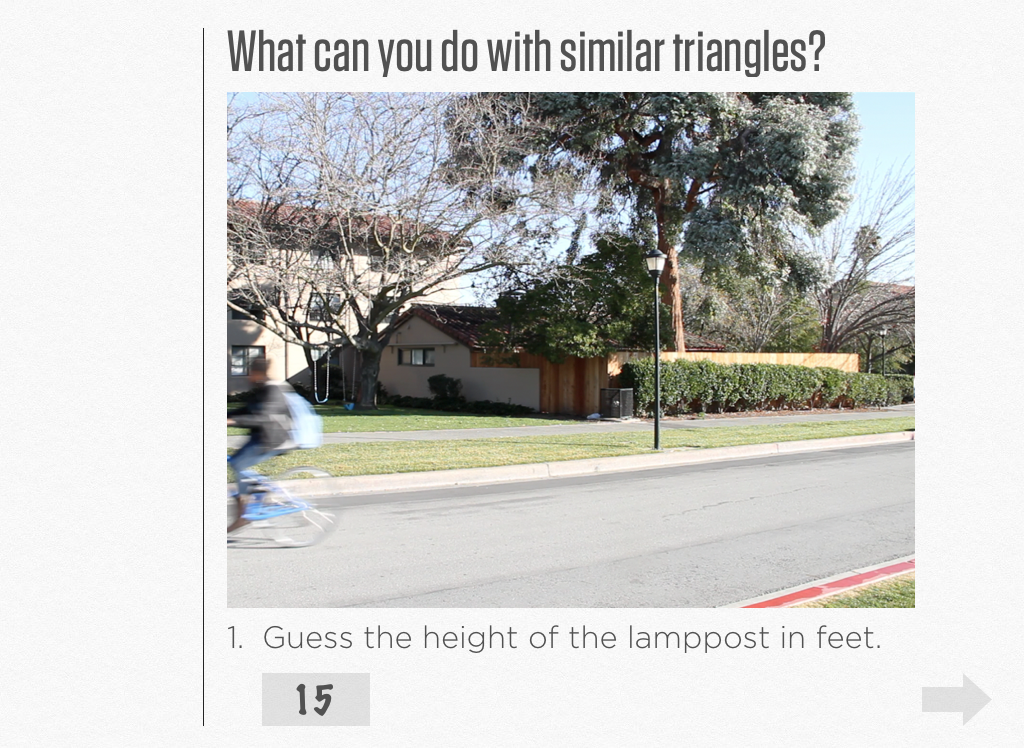
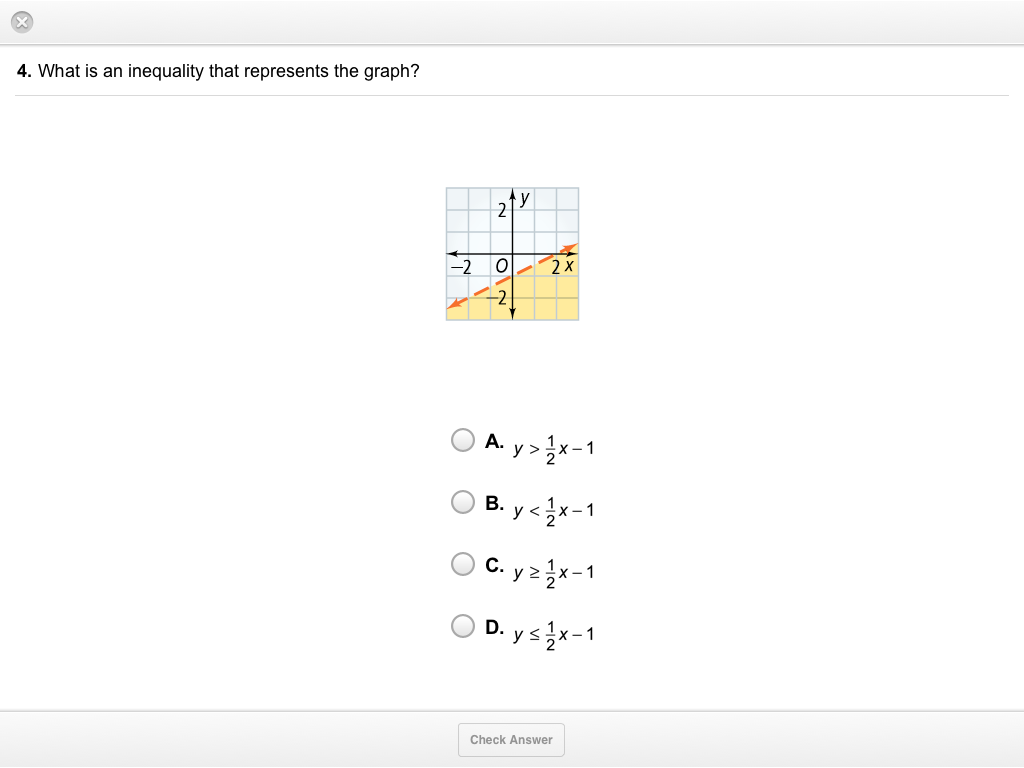
Here is the kind of page you can design in iBooks Author (jumping off our recent discussion):
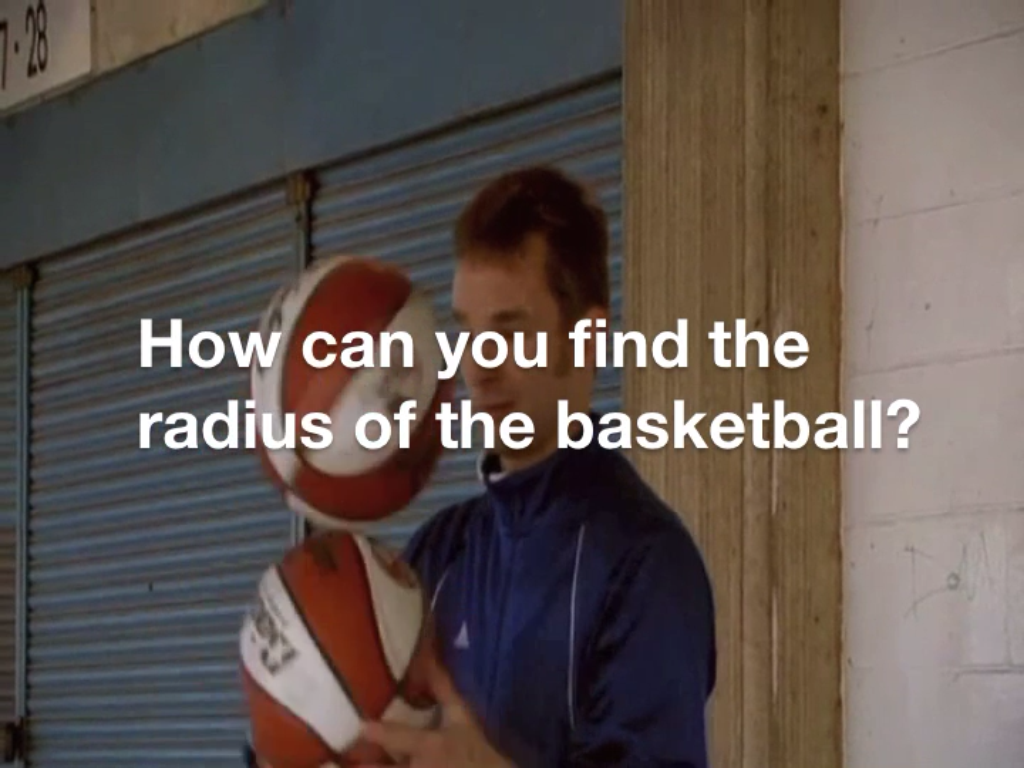
But here’s the kind of page I need:
You see the difference? I’m not just asking the question to engage students. I need to know what they think. I need to know if they even have the first, most concrete clue about the height of lampposts. It’s curious that even though students own their iBooks forever (ie. they can’t resell them or give them away), they can’t write in them except in the most cursory ways.
Even curiouser, these iBooks could all be wired to the Internet and wired to a classroom through iTunes U, but they’d still be invisible to each other. Your work on your iPad cannot benefit me on mine.
Check out how awesome that could be:
Again: low barrier to entry. The student’s answers from the last screen prepopulate the table in the next.
The student might sense that one of those points was incorrectly chosen and check her work. Or maybe the student wasn’t expecting any kind of pattern to emerge so she’s nonplussed by the haphazard, non-linear arrangement of her points.
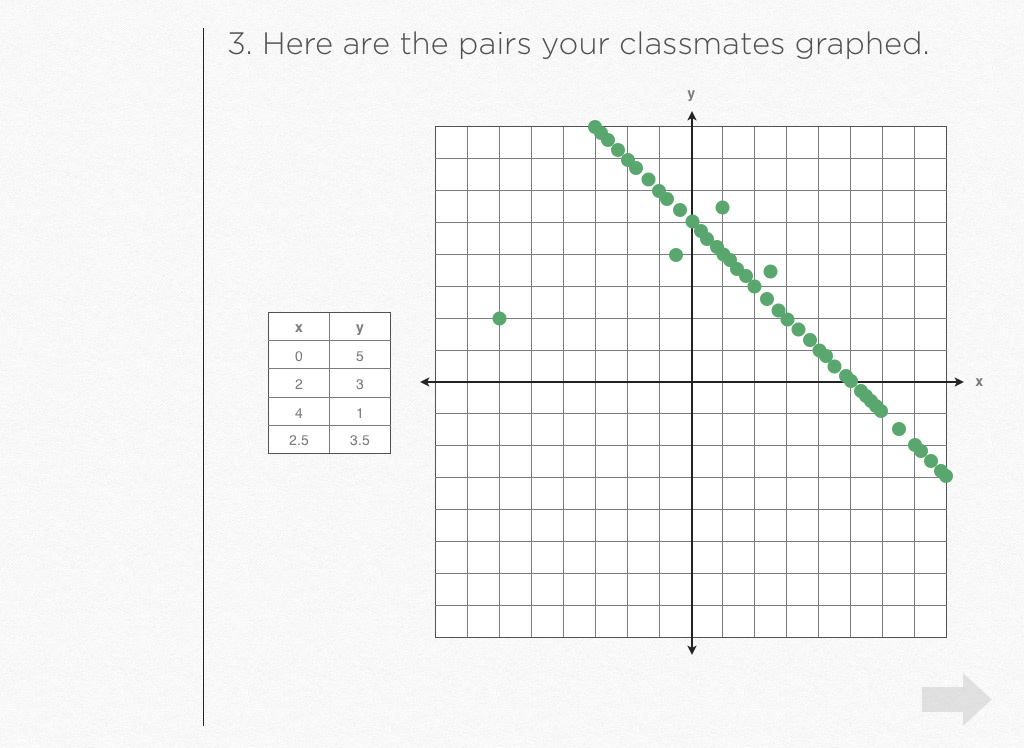
So then we pull in every point chosen by every student in the class and we finish the abstraction, examining points that deviate from the pattern, assigning variables to the pattern, giving the pattern a name, then creating and identifying other similar patterns.
Print textbooks are powerless to facilitate that moment right there. Teachers can’t facilitate it, not at anywhere near the speed and ease I’m suggesting. iBooks Author can’t facilitate it either, but if it could – if it had some kind of “Q&A” widget that lived alongside its other widgets and basically copied all the options from Google Forms – I’d find the platform difficult to resist.
But iBooks Author doesn’t exist for the pleasure of math education publishers or even education publishers. “This is about Apple versus Amazon for who will sell digital literature in the future,” says Audrey Watters. “This isn’t really about textbooks.”
iBooks Author serves publishers, period. It’ll help you publish your Firefly fan fiction, your autobiography, or your Nana’s recipe collection. It’s extremely useful, broadly speaking, which inevitably means that, narrowly speaking to math education publishers, it’s much less useful.