Year: 2013

Total 117 Posts

[Makeover] Postage Rates

The Task

130715_4lo

This is from Pearson’s Algebra 1 textbook for iPad.

What I Did

  • Establish a need for the graph, in general. Why are we drawing a graph? What’s the point? Does my ability to draw a graph serve any larger purpose than getting me points on an assignment? This task doesn’t have an answer to that question.
  • Establish a need for the step graph, in particular. Why are we drawing a step graph? What’s the point. Does the step graph have any advantage over other graphs? This task doesn’t have an answer to that question.

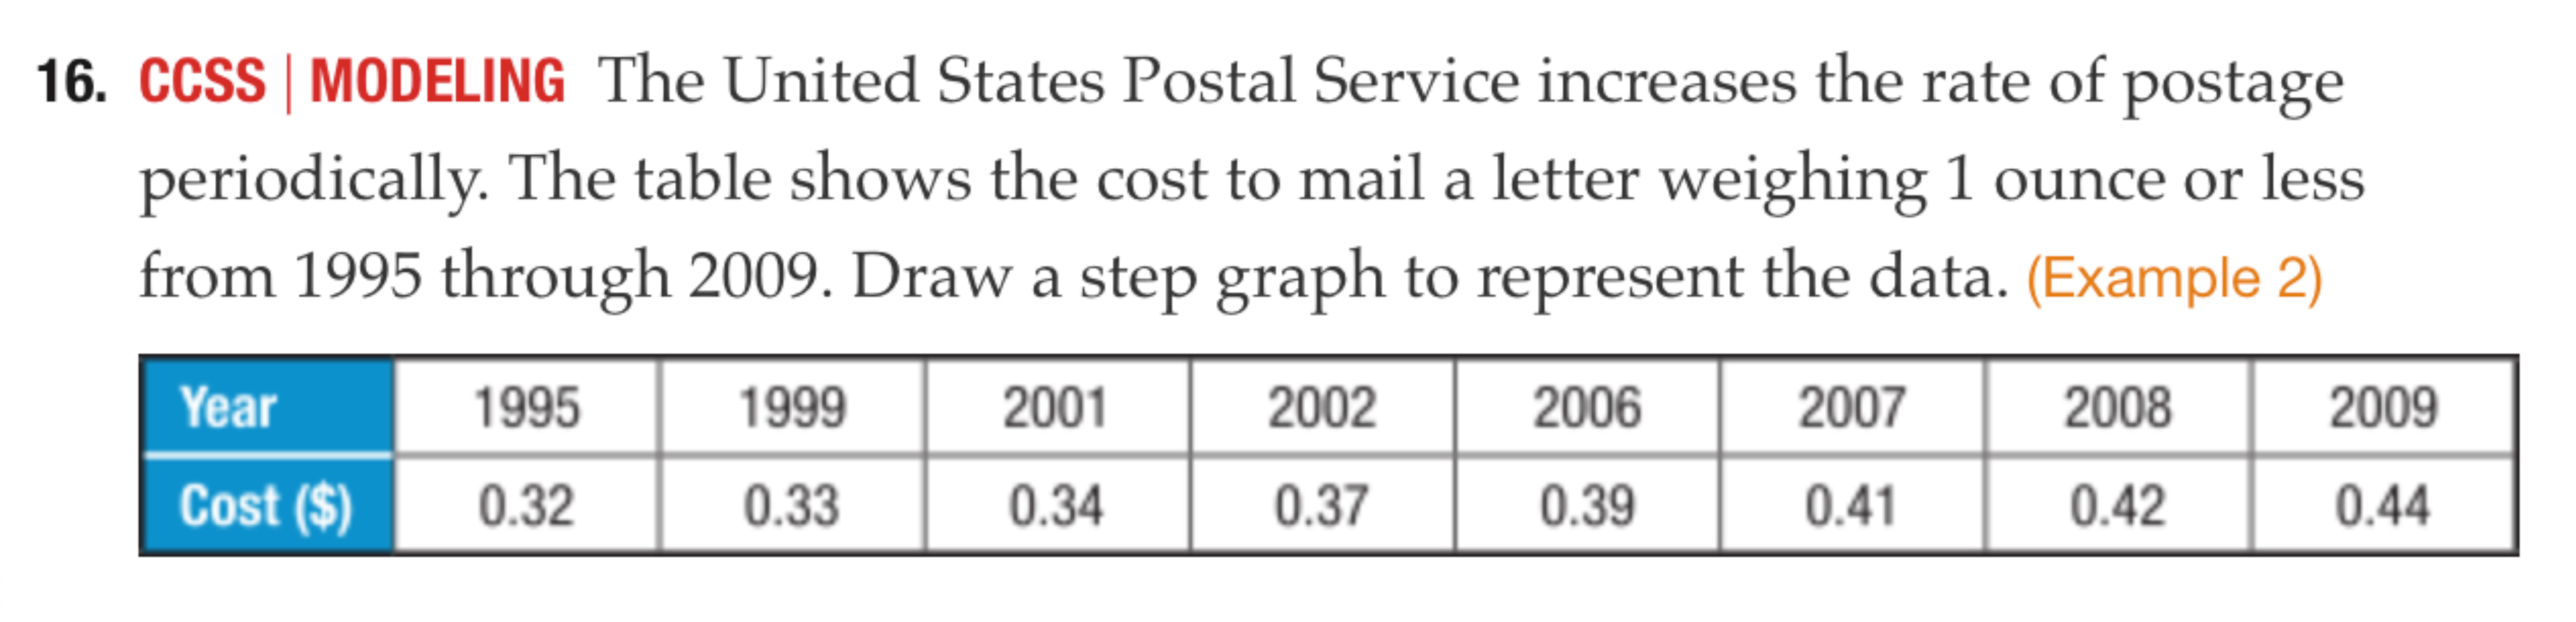
Tom Ward has me covered on the first point. Nothing’s topping this aspirational save-the-date for his 2019 marriage to Ms. Stone. What will postage cost then?

130727_1

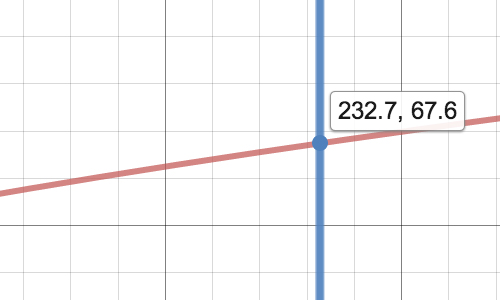
Graphs and equations of data are useful when they let us predict something external to the data we know. We don’t know the price of postage stamps in 2019 so we can extend a linear model beyond the data and find out what it might be.

130727_2

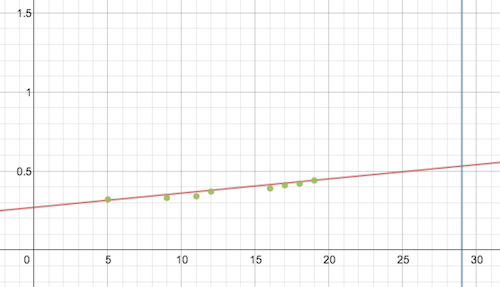
Mr. Ward will need to scrounge up 54 cents per invitation.

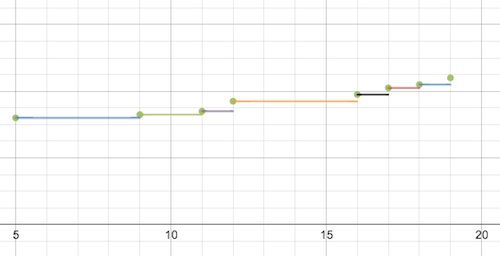
But he still hasn’t given us a reason to care about the step graph. For that we look at internal data. We tell the kid, “Hey, your graph is messed up. If you hand that graph to someone, it says the cost of postage in 2003 was 39 cents and the cost in 2005 was 41 cents. But the cost in both those years was only 37 cents.”

If you’re going to make a graph that tells the story of the data accurately you’re going to need a different model than a straight line. Enter the step.

130727_3

What You Did

Aside from Tom Ward’s superb work, over on the blogs:

  • Scott Hills seizes the opportunity to show students the benefits of a well-scaled axis.
  • Beth Ferguson removes step graphs from the task, which is one way to handle the problem.
  • Evan Weinberg goes digital, though I’m not sure what the digital medium adds here. He also just asserts that the student’s graph “should be a step function,” which highlights the difficulty again of motivating a need for this function family.

Over on the Twitter:

Featured Comment

Zach Lair:

Instead of a wedding invitation, change it to a graduation invitation. Have the kids estimate how many invitations they would have to mail out. They could then calculate the cost of their invitations. You could also have them calculate the cost that their parents/grandparents paid for their graduation invitations.

Computers Are Not A Natural Medium For Doing Mathematics, Ctd.

You may have heard that San Jose State University’s recent partnership with Udacity ended with MOOC-enrolled students passing courses at much lower rates than their on-campus cohorts. Lots has been said about these results (Phil Hill has a good round-up of the coverage) but there’s one line that deserves more coverage:

When students did get to the online programs, even navigating the computer systems could be daunting. One of the questions that tutors were frequently asked was how to do exponential notation on a computer.

Again we find computers are not a natural medium for doing mathematics. There’s nothing intuitive about pressing Shift + 6 to write an exponent, no inherent connection between the idea and the action. This isn’t true for computer science, where the medium is perfectly suited for the course. Or even for English composition, where typing words is only one intuitive abstraction away from writing them with a pen.

I’d wager 90% of people reading this already know how to type an exponent on a computer. They believe it’s easy enough to teach and I don’t think they’re wrong. But this is only one instance of a problem with a lot of reach. Notation makes math difficult on a computer. But notation also makes math more powerful and interesting. That tension will be very difficult to resolve and, so far, online math providers have generally resolved it in favor of the computer at the expense of math’s interest and power.

In our relentless transition from classroom-based math to computer-based math, these SJSU-Udacity results offer us a chance to pause and ask ourselves, “What’s now missing?”

Previously

Computers Are Not A Natural Medium For Doing Mathematics

2013 Jul 26. Okay, taking friendly fire on Twitter, I posed this challenge:

Use a computer to compose a clear proof that a triangle’s midsegments create similar triangles and send it to me for assessment.

My guess is you’ll find the process a lot less annoying and a lot more clear when you pick up a pencil and some paper.

Featured Comments

David Lippman:

But on the other hand, the reality is that if our students use math any time later in their life, there’s a really good likelihood it will involve a computer, whether it’s using Mathematica to solve complex problems, doing computer programming, or just entering formulas in Excel. There is value in learning the notation for entering formulas in a computer, and it provides an valuable side benefit of reinforcing proper syntax to ensure proper order of operation.

Mr. K:

I’ve slowed down on the Euler Project problems, but last I checked, I was just short of 200. Those problems require a computer to do the math, but you don’t do the math on the computer. I have a notebook (ink on paper) dedicated to that that has a couple hundred pages filled with notes and drawings — that’s the math.

[Makeover] Tire Marks

The Task

130715_1lo

What I Did

  • Reduce extraneous literacy demand. A lot of visual information has been encoded in text. Let’s get that information back in its natural medium.
  • Delay the abstraction. Tables and graphs and equations will eventually be useful but let’s delay their introduction until we need them.
  • Get a better image. The illustration here is a member of the “job testimonial” genre. ie. “Trooper Bob uses math, so you should too.” I’m unconvinced that message will sway classroom opinion on Algebra even a little. Instead let’s put the student into Trooper Bob’s shoes, doing Trooper Bob’s work.
  • Ask a better question. Neither of the two questions here addresses any of Trooper Bob’s concerns. The first has you extend a graph for no discernible purpose. (And why extend the graph from 60 feet to 100 feet. Is that just arbitrary?) The second poses the fantastic scenario where Trooper Bob comes to the scene of a wreck already aware of how fast the car was traveling and then proceeds to do math to figure out the length of the tire marks in front of him. Which he could just measure.
  • Add intuition. Per usual.

So show this picture of a wreck. Ask your students to guess how fast you think that car was going when it hit the brakes. Tell them they have to figure out if it broke the law. Do they think it was speeding?

130721_1lo

Then show them this image.

130721_1lo

Ask your students to rank the cars from fastest to slowest. Ask them how they know. They’ve decided the variables “length of skid” and “speed” are positively related. But what kind of relationship is it? This is where a graph — a picture of a relationship — is so useful. Show them the data.

130721_1lo

Have them graph the data. This is a little new to us. It isn’t linear. It isn’t quadratic. It isn’t exponential. Offer an explanation of the root model. It’s the inverse of a parabola. With the parabola, a little growth in the horizontal direction results in a lot of growth in the vertical direction. With the root model, a lot of growth is required in the horizontal direction before you get even a little growth in the vertical direction.

130721_1lo

Now they can find the exact model for these data and evaluate it for 232.7 feet.

130721_1lo

68 miles per hour in a residential zone? You won’t be needing that drivers license for a long time.

What You Did

Over on the blogs:

Over on the Twitter:

  • Nicholas Chan encourages modeling also, where students make predictions from data.
  • Eric Scholz has the same, except where I start with the accident you’re trying to solve and then get smaller data for modeling, he starts by showing students the smaller data and then ending with the accident you’re trying to solve. Is the difference substantial?
  • Matthew Jones sends along this clip, which would make for interesting watching after our math work. I’m not sure what work the students would do on the video, though.
  • Kate says, “bring the cop to school,” which could be great, but again what math work do the students do?

Featured Comment

Paul Gormley:

Now this is the reason I follow this blog. I am a criminal justice instructor and many students come to my field as fugitives from math and science. Use of these materials is helping me develop criminal justice contextualized math resources for a class proposal.

What We Can Learn About Learning From Khan Academy’s Source Code, Ctd.

I’m used to seeing pedagogy manifest itself in lesson plans and classroom observations and curriculum and videos. It’s interesting, now, to see pedagogical decisions manifest themselves in web design and code also. For example, here’s some Javascript from Khan Academy’s box-and-whisker plot exercises.

130716_1

Head over to the exercise. Complete a couple. What pedagogical mistake has Khan Academy made in the highlighted lines? How would you fix it?

Don’t get put off by the code. If you’ve taught box-and-whisker plots, you can sort out the issue here.

Previously: What We Can Learn About Learning From Khan Academy’s Source Code.

[via Travis Olson]

Featured Comments

Brian lands it:

This code will always generate 15 data points, and these points will not have any outliers (outside 1.5 * (Q3 — Q1)), so students can just pattern match and drag the lines to the 1st, 4th, 8th, 12th, and 15th places once they’ve sorted the data. It’s kind of fun the first time.

Dan Anderson piles on:

Agree with Brian. Always 15 data points? Never have to deal with “having two medians”? Ever? The data is between 0 and 15 (never -40 to -30, never 100 to 1000, never 0.80 to 1.15)? No outliers? Always starting with the data and making a box-and-whisker, never using the box-and-whisker to make conclusions?

Peter Franza picks on a different issue:

I think the largest error is the reliance on random numbers to provide a set of assessments that test an actual set of knowledge.

Random number generators are great for creating a large set of problems that are all basically the same, but in my experience you can provide better assessments/examples with a much smaller set of questions that are designed to illustrate the concept.

Michael:

Others have danced around it, but the fundamental flaw (as in some, but not all, Khan exercises) is that you get

THE SAME QUESTION

seven straight times, without any change in structure or difficulty, even though the underlying task has a huge variation in structure and difficulty.

Ben Alpert responds from Khan Academy:

I’ve updated the exercise so that it now includes anywhere from 8 to 15 points, so students are forced to deal with two middle numbers, both in finding the median and in finding the quartiles.

[Makeover] Meatballs

The Task

130710_1lo

This is from Discovering Geometry.

What I Did

Basically, I three-acted the heck out of it. Which means:

  • Reduce the literacy demand. Let’s encode as much of the text as we can in a visual.
  • Add perplexity. That visual will attempt to leave students hanging with the question, “What’s going to happen next?”
  • Lower the floor on the task. The problem as written jumps straight to the task of calculation. We can scaffold our way to the calculation with some interesting concrete tasks.
  • Add intuition. Guessing is one of those lower-floor tasks and this problem is ready for it.
  • Add modeling. We’ll ask students “what information would be useful here?” before we give them that information. That’s because the first job of modeling (as it’s defined by the CCSS) is “identifying variables in the situation and selecting those that represent essential features.” The task as written does that job for students.
  • Create a better answer key. Once we’ve committed to a visual representation of the task, it’ll satisfy nobody to read the answer in the back of the book. They’ll want to watch the answer.

Here’s the three-act page. Leave a response to see the entire lesson.

Show this video to students.

Ask them to write down a guess: will the sauce overflow? Ask them to guess how many meatballs it’ll take. Guess guess guess. It’s the cheapest, easiest thing I can do to get students interested in an answer and also bring them into the world of the task.

Ask them what information would be useful to know and how they would get it. Have them chat in groups about what’s important.

If they come back at you telling you they want the radius of the pot and the radius of the meatballs, push on that. Ask them how they’d get the radius. That’s tough. Is there an easier dimension to get?

Someone here may ask if the lip of the pot matters. It isn’t a perfect cylinder. Give that kid a lot of status for checking those kinds of assumptions. Tell her, “It may matter. It isn’t a perfect cylinder but modeling means asking, ‘Is it good enough?'”

Give them the information you have.

130713_2

130713_3

130713_4

130713_5

Let them struggle with it enough to realize what kind of help they’ll need. Then help them with the formula for cylinder and sphere volume. Do some worked examples.

Once they have their mathematical answer, have them recontextualize it. What are the units? If that lip matters, how many meatballs will it matter? Should you adjust your answer up or down?

Then show them the answer.

Surprisingly close. The student who decided to add a couple of meatballs to her total on account of that lip is now looking really sharp.

Let’s not assume students are now fluent with these volume operations. Give them a pile of practice tasks next. Your textbook probably has a large set of them already written.

Help I Need

  • Raise the ceiling on the task. My usual strategy of swapping the knowns and unknowns to create an extension task is failing me here. Watch what that looks like: “The chef adds 50 meatballs to a different pot and it overflows. Tell me about that pot and its sauce level.” I’m not proud of myself. Can you find me a better extension? I’ll give highest marks to extensions that build on the context we’ve already worked to set up (ie. don’t go running off to bowling balls and swimming pools) and that further develop the concept of volume of spheres and cylinders (ie. don’t go running off to cubes or frustums).

What You Did

Over on the blogs:

Over on the Twitter:

  • Max Ray, Michelle Parker, and Terry Johanson are all inside my head.
  • Ignacio Mancera poses a similar situation but suggests doing it live in the classroom. I don’t accept the premise that “real” always beats “digital” — there are costs and benefits to consider — but I think Ignacio and Beth have the right plan here. If you have the materials, do it their way.
  • Scott McDaniel suggests changing the context from meatballs in sauce to ice cubes in an iced mocha because kids drink iced coffee but don’t make spaghetti. This introduces a pile of complications (like the non-spherical shape of the ice cubes and the non-cylindrical shape of the cup and the fact that the ice will float at the top of the cup) for unclear benefits. Time and again in this series I’ve tried to convince you that changing the context of a task does very little compared to the changes we can make to the task’s DNA. Does someone (Scott?) want to make the case that the following task is a significant improvement over the original?

130713_1lo

Call for Submissions

You should play along. I post Monday’s task on Twitter the previous Thursday and collect your thoughts. (Follow me on Twitter.)

If you have a textbook task you’d like us to consider, you can feel free to e-mail it. Include the name of the textbook it came from. Or, if you have a blog, post your own makeover and send me a link. I’ll feature it in my own weekly installment. I’m at dan@mrmeyer.com

2013 Jul 16. A makeover from Chris Hunter in the comments. (I had forgotten how weird Orbeez look in water.)

Featured Comment

James Cleveland:

We just talked about this problem and your makeover at Math for America. One idea was to up the stakes: I’m putting this jar of water on top of a student’s phone. How many balls can I put it before it spills over? If you are sure you are right, put your phone under the jar…