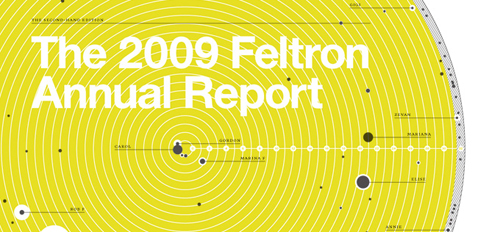
BTW: Referencing My 2009 Annual Report.
Technical
- Specs. Hardware: Mac Pro / 2.66GHz Quad-Core / 8GB ¶ Software: Excel 2004, Photoshop CS4, After Effects CS4, Final Cut Pro 7.
- Workflow. I sketched an outline on paper, then ordered it in Google Docs and turned that into sixty Photoshop compositions. That took about two weeks. Then I sequenced those compositions into a slideshow of still images and synced them in Final Cut Pro to a Creative Commons track. After Effects doesn’t play nicely with music so I spent the next two weeks working deaf, working exclusively off the timecodes from Final Cut Pro. (ie “Okay, the pie graph needs to finish its rotation at 2:41:20.”) The first day I saw it with music was January 31, the same day I posted it.
- Music. I’m not saying I did anything fantastic to the music track, but I did have to sync the slides to the rhythm, making adjustments for longer segments (any of the “top five + other” bar graphs, the travel maps), cutting and blending the song so it complemented the content of the video. I am saying that Animoto won’t do this automatically. iMovie won’t do this automatically. And teachers consistently overrepresent the capability of those tools.
- Data Sources. I maintained active records in Google Tasks before transferring them to an Excel sheet biweekly which I backed up fastidiously over the course of the year. Perish the possibility I might lose it. ¶ I collected all music records passively through last.fm, which became significantly more accurate after I outfitted my car with a 30-pin iPhone cable and began tracking car audio. ¶ I also collected my mobile phone statistics passively through AT&T’s online billing system, which kindly exports data to Excel.
Mathematical
I don’t see any of my students buying this pitch but here it is anyway: I would have had to release this video somewhere in April if I didn’t have a working knowledge of a) the degree measure of angles, b) proportions, c) percents, d) coordinates, e) 3D space, f) modular arithmetic, and g) linear interpolation. I even calculated an integral.
Here’s just one example. You noticed the little animated counters running all throughout the project? Problem: you want the counter to read “0” at 773 frames into the composition and “44651” at 795 frames:
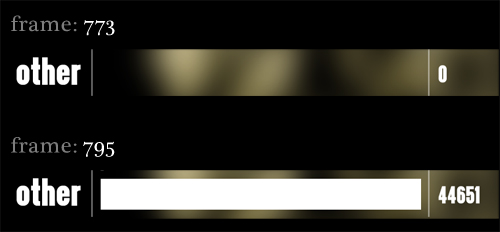
Solution: a linear equation!
Math.round(timeToFrames()*2029.59-1568872.77)
Miscellaneous
- Guilt. I watched a continuous 20 days and 23 hours of television and movies. I could slap qualifiers all over that statistic but you’re still talking about nearly a month spent proximate to a flickering light.
- Battlestar Galactica. Not worth it.
- Guilt II. 18 gallons sounds like kind of a lot of beer when you put it that way.
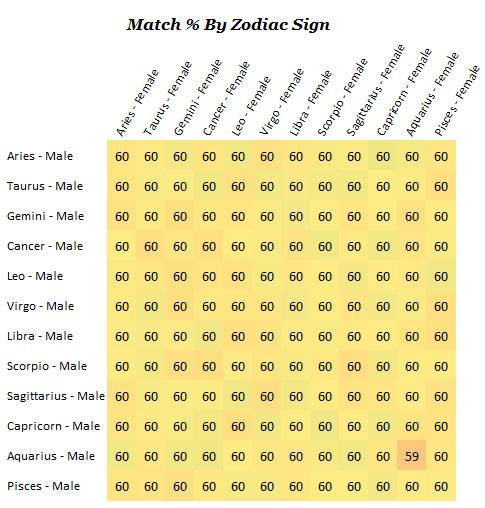
- Margin of Error. I’ll put the average margin of error for the project somewhere below 1%. And I’ll wager the sleep statistics are the worst. I had to remember to take a screenshot of my iPhone’s clock wallpaper twice a day at the two times of the day that I was the least likely to remember to take a screenshot of my iPhone’s clock wallpaper.
- 2.5 Minutes. I’m really happy with the length of the piece. That’s, like, 2.4 days per second!
-
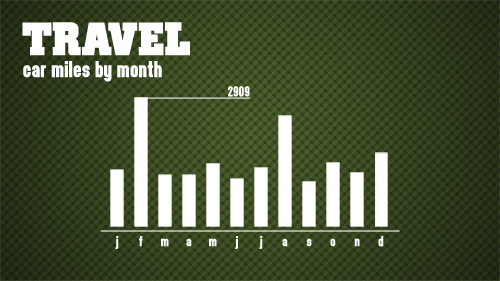
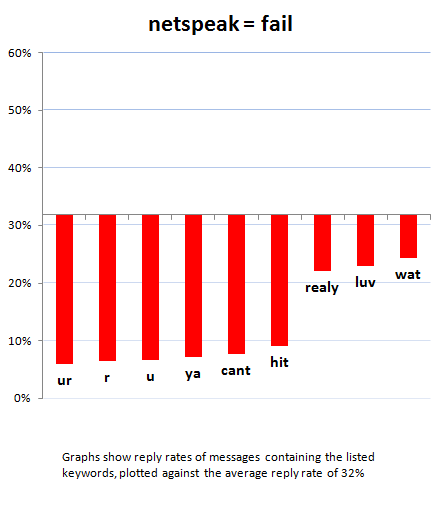
Editing. For every statistic I included there were two I cut. There were albums and songs; incoming calls, outgoing calls, outgoing messages, fastest rising message recipients as well as fastest falling; places where I drank beer, number of people with whom I drank beer; repeat vs. first time movie viewings, number of people with whom I watched movies; plus a host of Twitter statistics and a Wordle visualization of my 2009 text message content which were, predictably, pretty dull. ¶ The most poignant graph that I cut for length was this one, which features both my father’s cancer diagnosis and, relatedly, the fact that I drove the length of the US in one month without leaving California.
What a strange project.
- 2010. It’s been two years and I can’t see quitting this kind of introspection. I’m already anticipating my decade retrospective where I hope I’ll see a lot of huge life changes reflected in microscopic daily statistics. That’ll be great. ¶ My goal for next year is to post my completed annual report video no later than January 1, 2011. I don’t think this is impossible. Andrew Kramer recently composed a convincing tutorial explaining dynamic bar graphs in After Effects, where you just enter the final data and Javascript recomposes the entire project. The trick will be extending that process across an entire video and several different infographics. In any case, I need to publicly throw down this gauntlet.