At this point, we offer each of the following contestants 48 hours (until 16:30 PST 2009 February 5) to send a ranking of their top three picks to dan@mrmeyer.com (excluding their own). A ranking seems almost vulgar in light of all this great introspection and design but these prizes won’t give themselves away, etc.
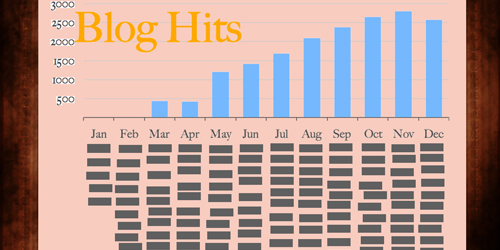
Sarah Cannon
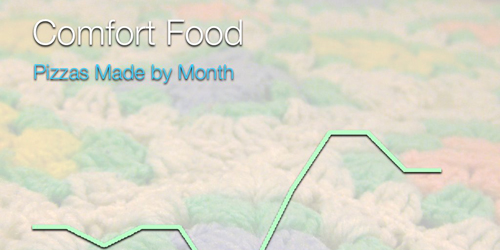
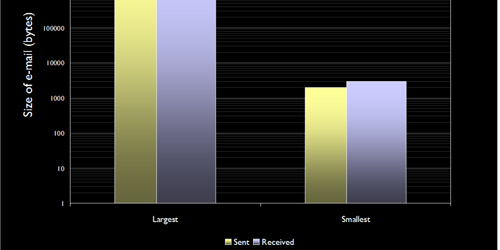
I like not having the scale shown on these. Full confession, I did not track all of this data, so some of the numbers are guessed. My personal favorite slide is the one with the least fact behind it and my least favorite is the one where I can tell you the numbers exactly. Go figure.
Collette Cassinelli
… this year I used the opportunity to play around with Photoshop – something I never take the time to do.
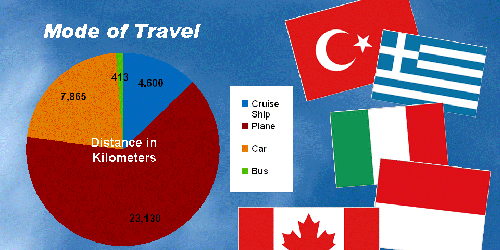
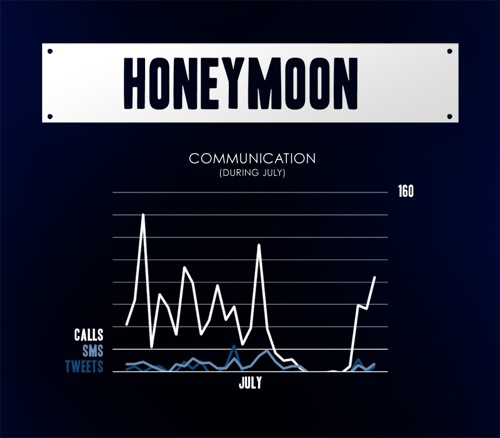
Simon Job
With Sarah, our first child, born this year — her arrival and impact on our lives defines 2008. These 4 slides show just some of what’s been happening so far.
Fred Knauss
I’m going to side with Don Norman, and say that In a proper design, both are important. Though, if there is some imperfection, I think that having beautifully laid out information that is incomprehensible is worse than an eyesore that tells a good story.
Erick Lee
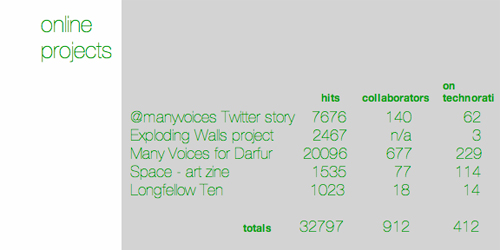
George Mayo
Alice Mercer
I only had two infographics. Why? I don’t keep a spreadsheet with the minutiae of my life. I know that some consider this useful, or therapeutic. In my family, it usually comes with a three letter acronym diagnosis from the DSM IV. No aspersions on Dan or Mr. Feltron, but I’m not into that.
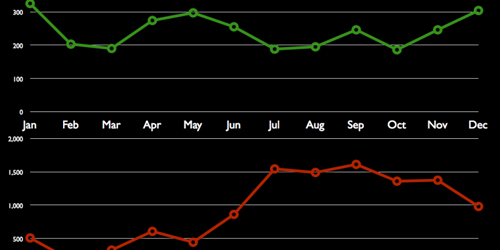
Alby Reid
Sam Shah
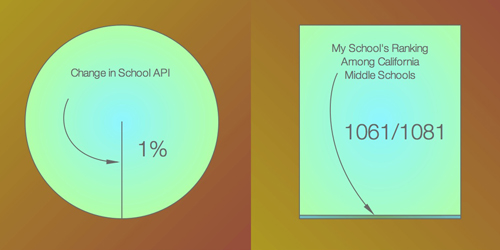
I’m slightly disappointed with this set of slides I made because they don’t tell a story. My slides from last year (2007) told a story – of moving to NYC and changing careers. There was text which explained the stages of my year. This year my slides – hastily done – don’t tell a coherent story.
Claire Thompson Thomas
Ben Wildeboer
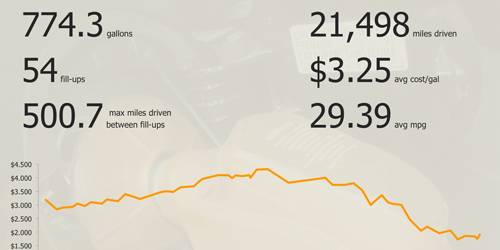
Luckily I’m just dorky enough to keep track of a few data sets of interest to me. I was also lucky to have a snow day today- otherwise these would probably not be complete.