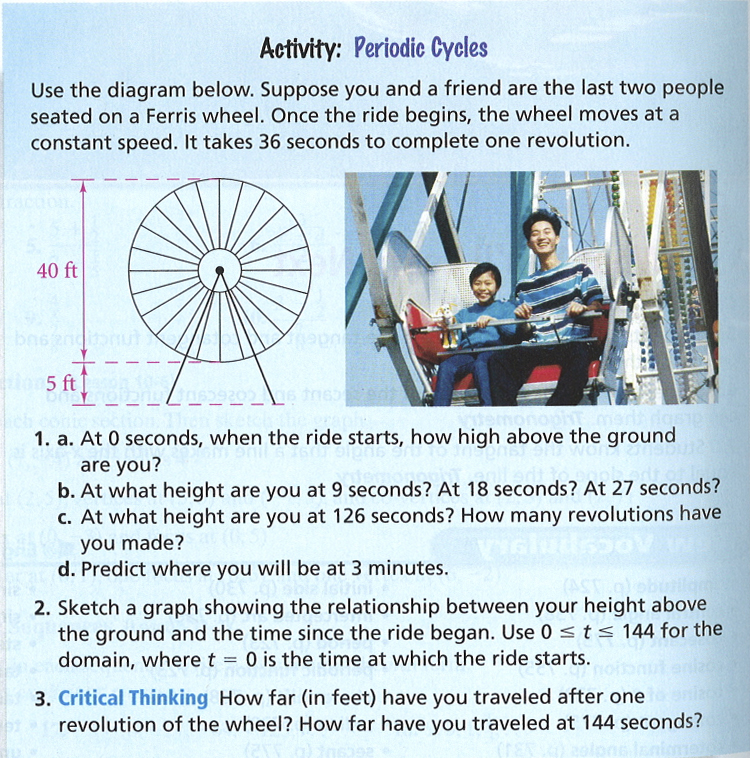
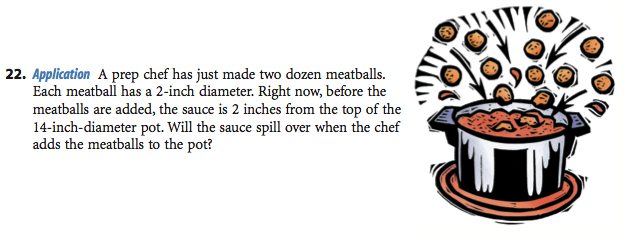
The Task
What I Did
TLDR: Here’s the 101questions page.
- Start concretely. Saying “it takes 40 seconds to complete one revolution” isn’t the same as seeing a ferris wheel travel at that speed. ¶ The task also asks students to trace the path of a car on a ferris wheel, precisely, point by point, for a given domain. We’ll get to that kind of precise abstraction in a minute but for now I’d like an actual sketch. I want to know how my students see the ferris wheel’s motion.
- Give a reason to give a damn. Here, as with our last Makeover Monday, you’re asked to create a graph simply because we said so that’s why. There isn’t any sense that a graph could be useful for anything more interesting than receiving a grade.
- Raise the ceiling on the task. We’re attempting to lower the ceiling by starting more concretely, with a sketch, but we’ll also help students develop the periodic concept further than the current task does. (The “critical thinking” extension task here doesn’t develop periodics so much as call back to circumference.)
- Prove math works. The task asks students to “Predict where you will be at 3 minutes” but we don’t get the payoff. Do periodic functions actually predict where you’ll be?
Play this video.
Pass out these empty graphs [pdf]. Ask students to graph the height of the red cart above the ground as best as they can for two complete spins. We aren’t asking for exactness yet. We’re looking to see:
Do they create smooth maxima and minima or pointy, non-differentiable cusps? If they’re making cusps, they’re suggesting the cart bounces at the top of the ferris wheel.
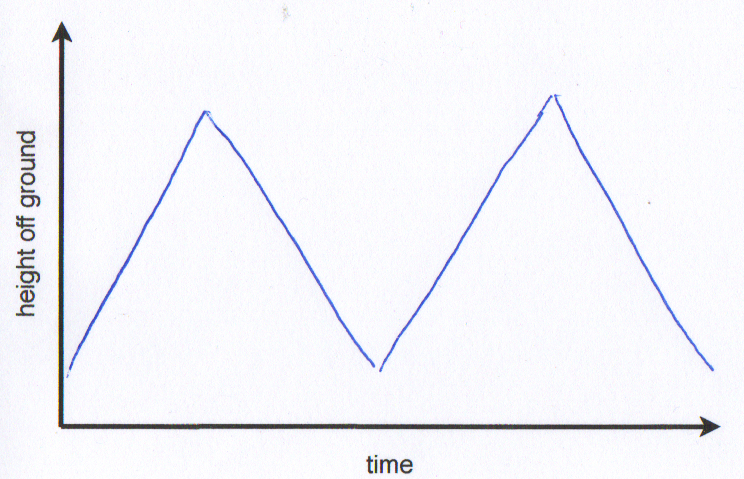
Are all their maxima at the same height? Are all their minima at the same depth? If they’re different, they’re suggesting this metallic ferris wheel shrinks or expands over time.
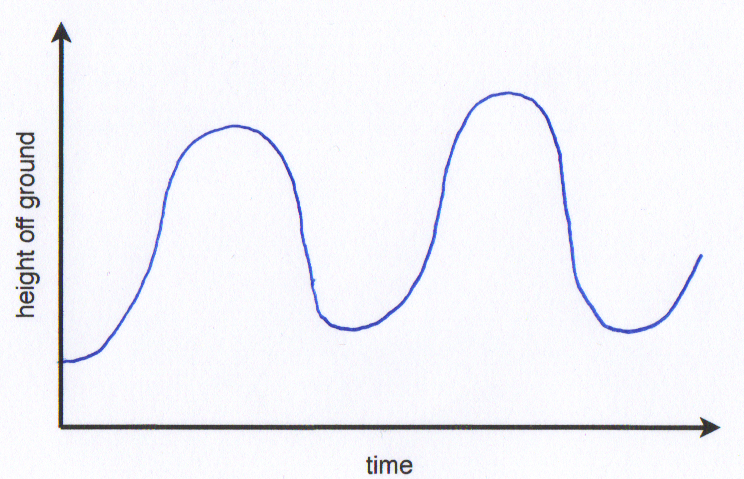
Is the horizontal distance between maxima the same? If they’re different, your students are suggesting the cart isn’t moving at a constant rate, that it speeds up or slows down during the ride.
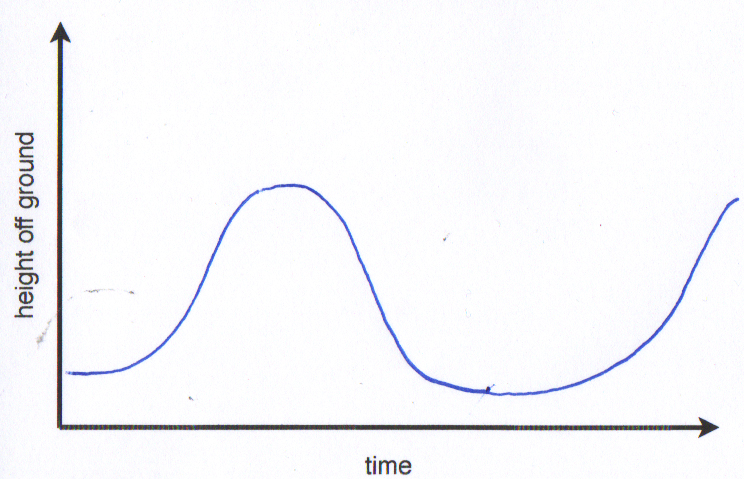
Are their minima a few feet above ground level? Or are they suggesting the red cart hits the ground at the bottom of each turn?
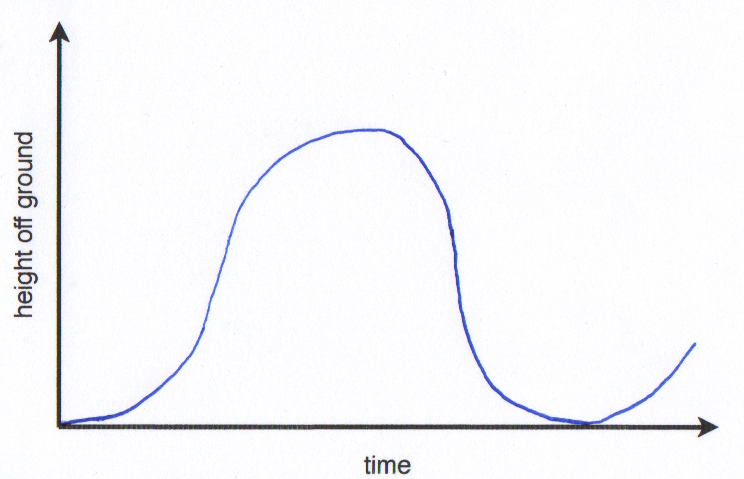
In every case, push your students to attend to precision. (Common Core achievement unlocked!) Give them more of these graphs or have them hit erase on the tablet and start again. Get it right. Be precise.
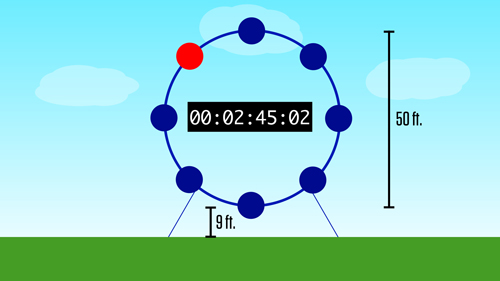
Now that we’re pretty clear on the structure of this new kind of function called “periodic,” let’s step our game up. Ask them to guess how many full turns the red car will take before its ride is over. Tell them their other goal is to figure out exactly how high off the ground the cart will be at the end of three minutes. (Real-world relevance achievement … still pretty much locked.)
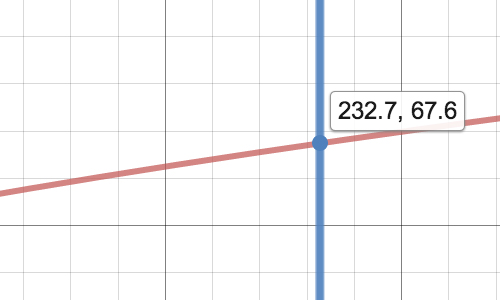
Now we’re ready to start the task as written. Use this screenshot with information. Head to Desmos, kids. Punch in points that are more obvious to you. The minima. The maxima. The position at far left and far right. Keep that going.
Students need to see that their old models are useless to describe these points. So give them a new one. Out with y=mx+b. In with y=asinb(x+c)+d.
Have them mess with the parameters until they get a perfect fit. Then use it to find the position at 3:00.
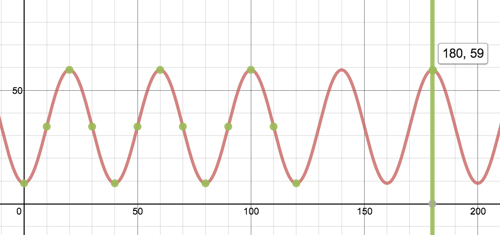
Now show them whether or not the model actually works.
For an extension, perhaps ask:
- How long should a ride last so the person ends at the bottom for an easy exit? A: Lots of different correct answers here. That’s the fun of a periodic function. Hey write out all the correct answers in order and subtract one from the next. What’s happening here?
- If the ferris wheel spun backwards, how would that change your periodic function and your calculation?
- Where else would periodic functions make sense as a model?
What You Did
Over on the blogs:
- Michael Pershan beats me to the punch and asks his students to just sketch the ferris wheel first.
- Beth Ferguson draws from a collection of periodic applets.
Previously. The preview post where you’ll find some other interesting ideas.