Some of my students fabricated their data, that much was obvious. The question was, which ones? I passed this graph out to my students and asked them to come up with a definition for cheating.
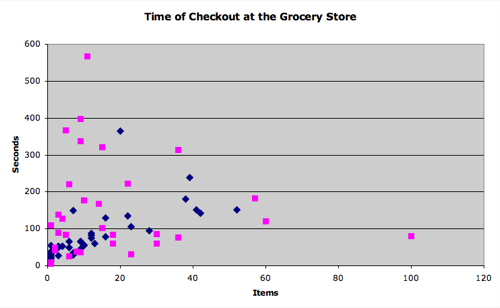
Most of them circled the same four extraordinary outliers but very few students could come close to verbalizing why they chose those outliers. It was just … obvious. The formula for statistical error was so intuitive they couldn’t verbalize it.
Something I enjoy about computational thinking (the focus of my position with Google) is that it asks you to explicitly verbalize processes that may only exist in your intuition, processes that are too obvious for words.
Case in point: which of these is a US penny?
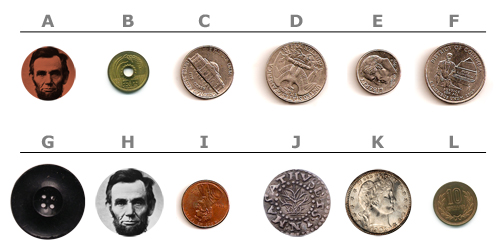
100% of my students would correctly select I. But if I asked them, “Why? How do you know?” and requested a “Penny Determination Algorithm,” the sort of thing you could give to an alien race to identify our one-cent currency, it would drive them crazy.
“I don’t know. It’s just … obvious.”
My particular students may not be ready for that conversation but it would be a good one. We’d prioritize algorithms that used cheap inputs. After all, we could scan every coin and apply some kind of edge-finding filter in Photoshop, but that would be too expensive and time-consuming for the machine that counts your change at the supermarket. Once students completed their algorithms, we’d trade them around the room and try to throw exceptions at each other.
These conversations are very difficult to have with students whose teachers for the last eight years have a) defined the inputs for their students (“The area of a triangle depends on its base and its height.”) and b) given them the algorithms (“The area is half the product of the base and height.”).
Those students just want you to give them a sack of thirty objects so they can use the algorithm you gave them to answer the question, “which of these is a penny?” They don’t want to answer the question, “how do you know?” They wouldn’t know where to start.