Kate Nowak, on my recommendation that teachers ask for informal sketches before formal graphs:
I agree with everything you say here. However, I think you will get silent resistance on this because teachers don’t know what to do next if their students can’t sketch a graph. But they know their students can follow mechanical instructions, so they’ll fall back on that.
Waitaminit. Is that you? Is Kate talking about you? Let’s talk about this.
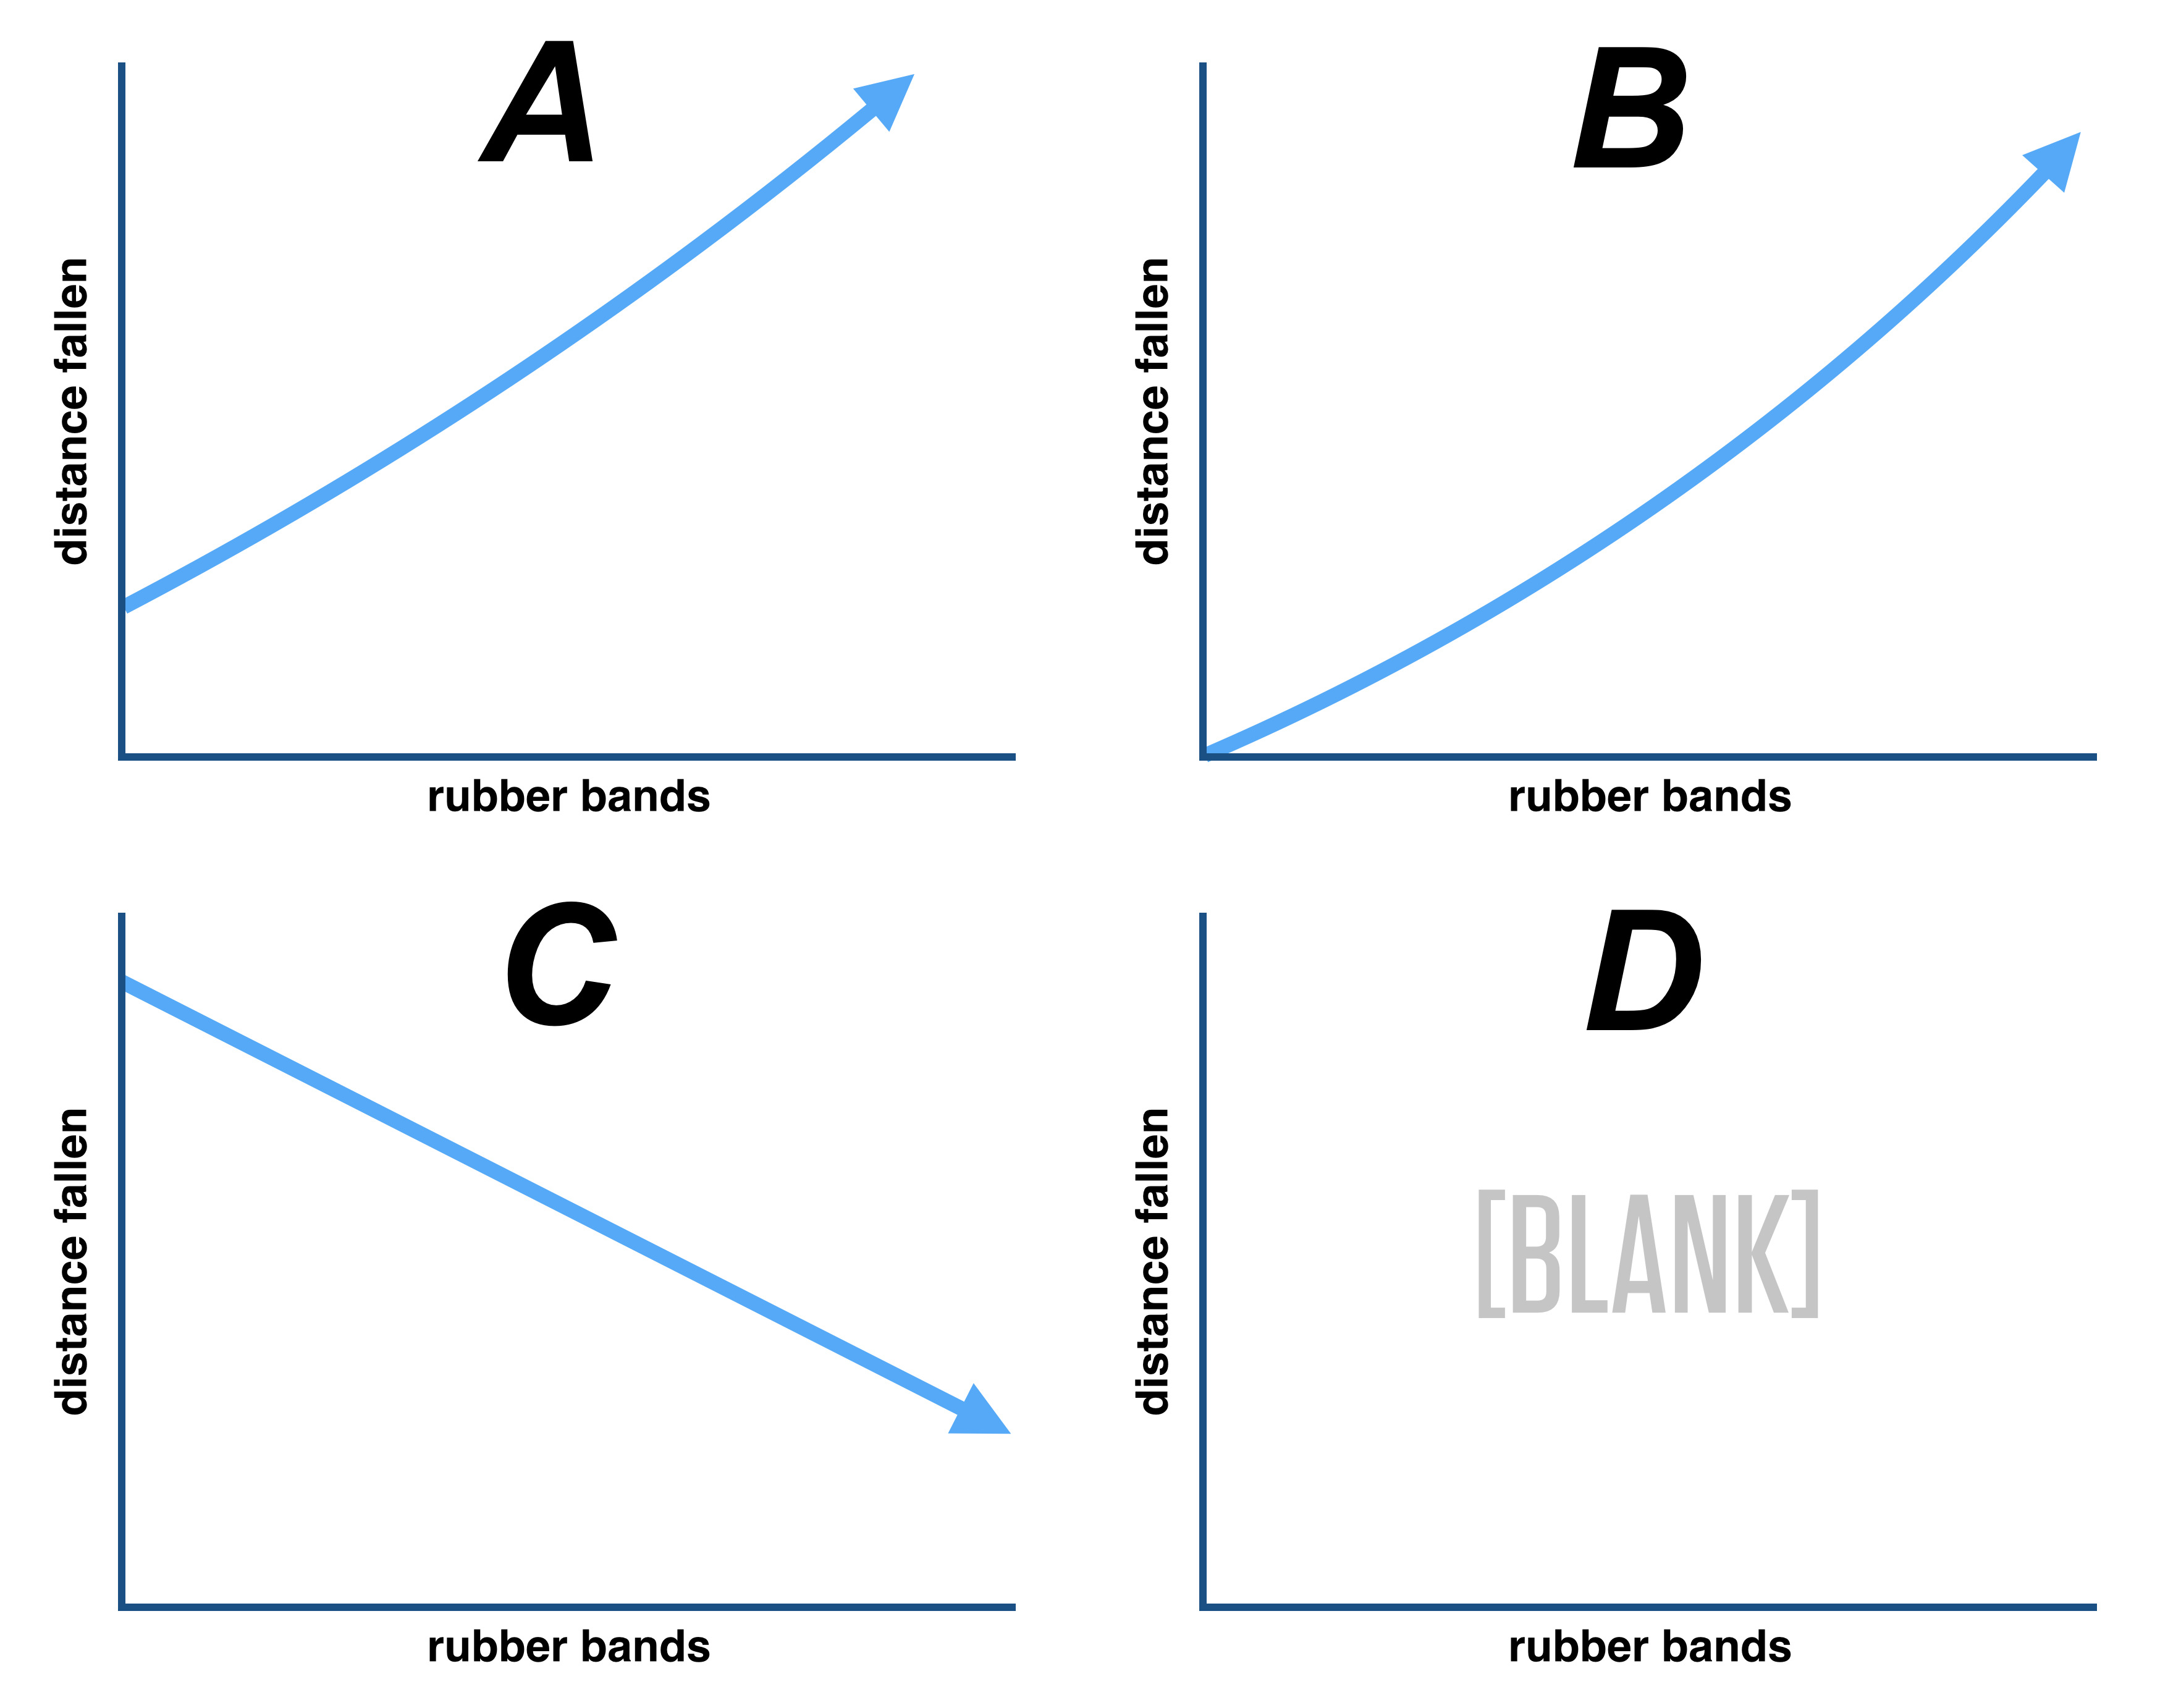
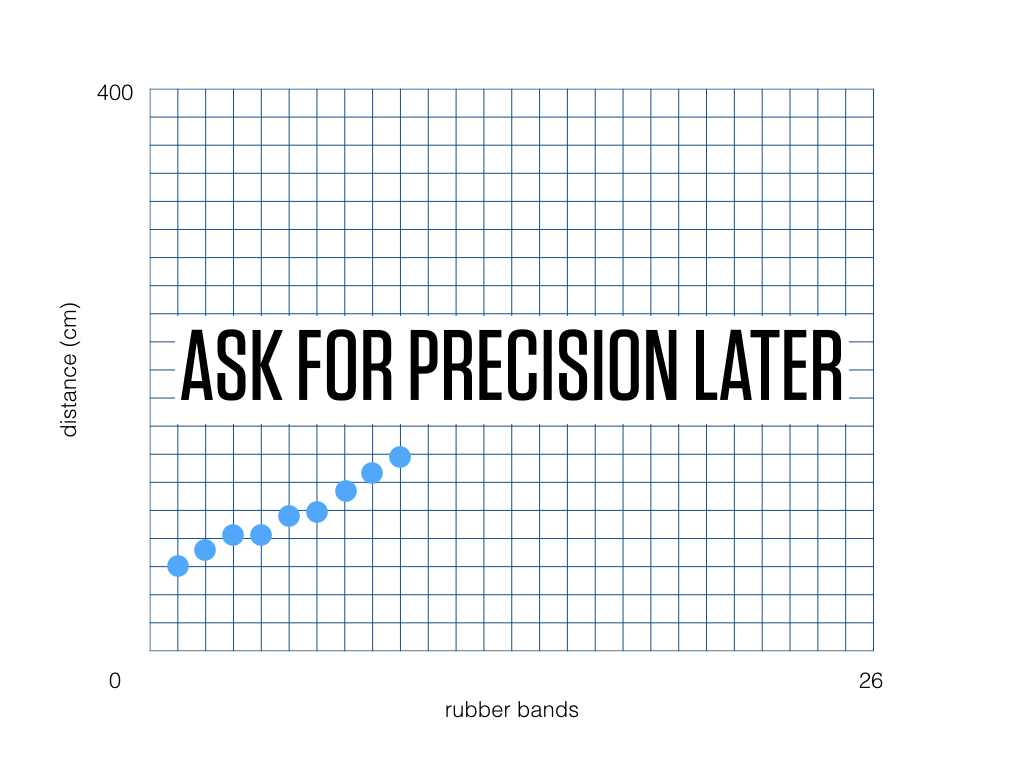
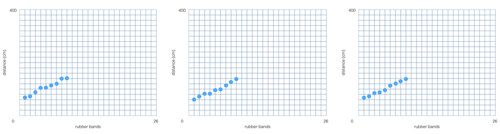
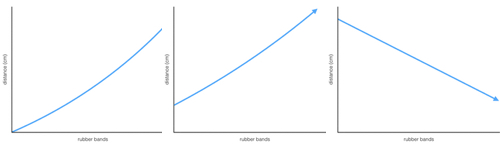
Let’s say you’re working on Barbie Bungee. You’re tempted to jump your students straight to the mechanics of collecting and graphing precise data but you decide to develop that question a little bit first. You ask them for a sketch and the results come back:
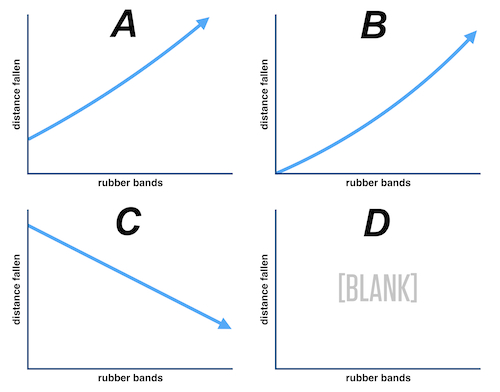
A is (basically) correct. With zero rubber bands, Barbie falls her height and no further. Every extra rubber band adds a fixed amount to the distance she falls.
So what would you do with each of these sketches? Me, I think I’d say the same thing to each student.
BTW. Kate is back in the classroom after a short hiatus so there’s never been a better time to watch her think about teaching.
Featured Comments:
Kate Nowak:
I’d need to think about it in context of the lesson and course flow. What happened before? What was done to orient them to the problem; do they have any concrete experience of the situation or is this more like just get something down, and then what kinds of things would they be basing their response on? What were your reasons for anticipating these 4? Are these kids in Algebra 2 or 8th grade? So I have more questions than answers.
gasstationwithoutpumps:
I’m an engineering professor, not a math teacher, and my courses are built around design projects. What I’d tell the students is probably what I usually tell the students in the lab: “Try it and see!”
David Wees:
All four of these kids appear to have slightly different models for understanding how this graph relates to Barbie falling. I’m assuming that we are just asking for a rough sketch here, as per your previous post.
#1 seems to indicate some important understandings of the relationship between the two variables. It is hard to come up with that graph by accident. My feedback to this kid would be to ask her what else could be modeled with this graph.
#2 seems to know that the more rubber bands there are, the longer the distance is. This is a pretty key understanding. I am curious about why they chose to start their graph at the origin, and I would ask them to explain their reasoning behind their creation of this graph. Either they will notice their mistake themselves, or I will have more information with which to ask a better question. One possible response would be to ask kid #2 and kid #3 to justify their graphs and defend them.
#3 seems to be confusing the graph as a map of the actual fall itself, but there could be other explanations for their choice of graph. For example, they could be interpreting distance fallen as just distance, in which case they might be thinking that this means the distance from the ground. I need more information about their thinking, and so I would ask them to explain to me what they have done, and then depending on their response, I ask another question.
#4 did not do the question. There are many reasons why this could be true. They could not be able to read, they could not have a starting place for figuring this out, they could be unwilling to make a mistake, they could be still thinking about the problem by the time I get near them, and more. I need to know more information. Is this a typical pattern from this student? Have they produced similar graphs in the past? What socio-emotional concerns do I need to be aware of? Based on my understandings of these questions, I would ask a question like “Can you explain to me what the problem is asking?” Ideally I have already spent enough time clarifying the problem before everyone started that this particular question will not give me much information (eg. the student does know how to explain the problem) and I will likely need to ask another question. Maybe I need to ask them to describe the relationship between rubber bands and falling bands in words first.
Denis Roarty:
My second reaction, when I read a few of the Barbie PDFs is that these things are so longgg …. I was a middle school science teacher and my ideal worksheet was a one pager. We did a lot of context building by talking through the prompt, what we needed to know and the experimental design. I didn’t always pull it off well, but I also didn’t have kids mechanically following my directions.
This is a series about “developing the question” in math class.