Category: digital instruction

Total 80 Posts

Moar!

Okay. okay. I feel like we’re getting somewhere w/r/t lesson and resource sharing online.

Swing by Ben Wildeboer’s hurricane investigation. I’ll cop to a lot of personal preference in this arena but no matter who you are or what you prefer, you’ve gotta notice what an advance this is on the traditional model.

  1. He presents his lesson plan as a narrative, stripping it of the usual prescriptive vibe (ie. “do [x] for twenty minutes; assess [x] now.”) which vibe is something like wearing a milkweed boutonnière on your first date. (Or, I guess, wearing a boutonnière on your first date period. Don’t do that.)

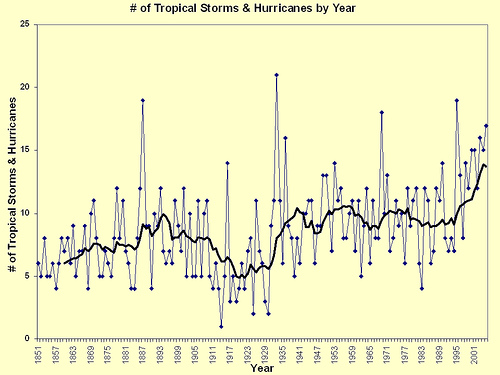
    [The usual explanations] didn’t cut it for my students. 15-year olds don’t have great appreciation for the subtleties and complexities of meteorological research. They wanted answers.

    I’m feeling it, y’know? The tension. Will they find answers? Will they?! HOW!?!

  2. He embeds photos, attachments, and links.

    Y’know: multimedia. The stuff that makes good teaching great, even when your students are teachers.

Obviously it doesn’t hurt Wildeboer at all that:

  1. he has enthusiasm for his content,
  2. he knows how to write,
  3. he leaves a few questions tantalizingly unanswered,
  4. his lesson has broad appeal, easily appropriated for math (via graph interpretation) and history (via Katrina & the environmental movement),

but, otherwise, a great, shared lesson plan really is this simple:

Present it as a multimedia story.

Which isn’t at all to say it’s easy, just that the ROI is spectacular when done right.

Bill Throws It Down

Bill Fitzgerald on aggregating lesson content:

If a critical mass of teachers (lets say, for the sake of pulling an arbitrary number, 40) start creating lesson plans on a sufficiently regular basis, I’ll commit to setting up and hosting a site that collects and republishes the content. Heck, I’ll even commit to writing up some best practices to make sure your lessons can be peeled off and aggregated separately from your other content.

And, at the risk of stating the obvious, this site will be ad-free, and yes, it will run on open source code.

Thirty-nine more hands. Get ’em in the air, people.

How Long Now

Plans For Us dug for traction, found none, and fell. Bill Fitzgerald seems to have sacrificed his infant lesson aggregation service at the altar of paid work. tteach has featured the same landing page for a year to diminishing returns. I guess I should console myself that I Love Math! is still around, such as it is.

But seriously.

Isn’t it a colossal joke that in this [flat, spikey, curly, whatever] world we live in, your best learning experiences and mine are still separated by geography?

Somebody please.

So Happy Together #4

Make the marriage of your digital projector and laptop a happy one.

One Idea:

Use visual callbacks to refresh their memory.

Like this:

We’re talking about tessellations, how squares and equilateral triangles tile your bathroom floor without gaps.

I put up a square / equilateral triangle in Keynote and after they draw the tessellation on their paper, I hit a button and the same thing animates on the screen.

The next day I want to talk about the general case.

Without my digital projector, I’d say, “Okay, so you guys remember yesterday how we saw that an equilateral triangle tessellated the plane? Will your garden-variety, no-account scalene triangle do the same thing?”

No one would contradict my first assumption but only, like, 50% would really remember.

With a digital projector, though, I just copy & paste a slide from the previous day, strip off its animations, and there I have an effective visual callback to the last lesson.

Just like the “Previously on Lost ” introductions, this technique functions even when pushed weeks into the past.

“Remember when we were looking at distance around the Earth last month?”

And they do.

Previous Editions:

So Happy Together #3

Make the marriage of your digital projector and laptop a happy one.

One Idea:

Become the teacher/learner hybrid.

Like this:

I buy some tea from the deli next to the school. $1.80. I’m at the grocery store the next day and notice a box of the same tea for $6.49. 18 bags. I start wondering, “how much is the deli profiting off our transaction?”

Then:

I take a picture of the box and put it in front of my beginning algebra classes the next day – today.

This is how we introduce rates: how it doesn’t just matter that the box costs more or that you get more tea in it rather you must consider the two things against each other.

After we divide price by bags and come up with 36 cents per bag, the students notice that same figure on the price tag. The grocery store helpfully makes these calculations for you.

So when I put up two more photos, two sports drinks, one in bulk, the other in miniature six-pack, I censor those figuresIn this particularly mind-blowing example, the cost per ounce was the same..

And we spend 45 minutes running computations, discussing the results, arguing over the significance of the results – all from three photos.

No wipes, checkerboards, animations, or other PowerPoint detritus. This is the 21st-century digital projector bashed back into the 20th century.

This is one of those carousel slide projectors I’ll only pretend to have seen in person. I’m only projecting still images but here, in the 21st century, I can draw those images from infinite sources from around the globe or my local supermarket.

This practice habituates like a hard drug. With a digital projector waiting back in my classroom, I can’t help looking for interesting, relevant images to put in front of my class.

A digital projector shrinks the time-gap between my learning moment and theirs.

A digital projector has effectively buried the difference between What Fascinates Me and What I Teach.

Previous Editions: